 Stay
Stay 
Trading Conditions
Products
Tools


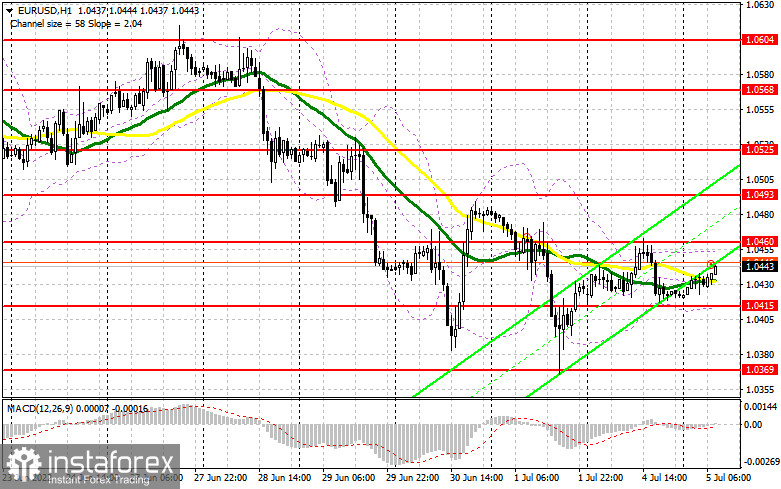
Yesterday, trading was calm as it was a public day off in the US. The fact that the bulls managed to stay firmly above the level of 1.0415 opens the way for a new upside correction. This is especially relevant after a failed attempt to break through the yearly lows on Friday.
For long positions on EUR/USD:
Today, markets expect the release of the business activity data in the eurozone for June. Analysts expect a serious decline in the composite PMI, in particular, in the services sector. If the reading turns out to be below the mark of 50 points, the euro may depreciate considerably against the US dollar. The best moment to open long positions will be a false breakout of the nearest support of 1.0415. This will create an entry point and an opportunity to develop an upside correction at the start of the week with the target of 1.0460, which the pair failed to break through yesterday. A breakout and a test of the 1.0460 level will trigger stop-loss orders set by the bears. In this case, the price may head for the level of 1.0493. A change in the market balance will be possible only when the price breaks through 1.0525 and retests 1.0568 and 1.0604. This is where I recommend locking in profits. If EUR/USD declines and there are no bulls at 1.0415, which is very possible if the eurozone data is weak, I would advise you to stay out of the market. The best scenario for going long will be a false breakout of the 1.0369 support zone. At the same time we should keep in mind that if the price tests this level for the fourth time, this will be a clear indication of a bear market. So, a strong upside movement is very unlikely today. I recommend buying EUR/USD on a rebound from a new yearly low of 1.0321, or even lower at 1.0255, keeping in mind an upside correction of 30-35 pips within the day.
For short positions on EUR/USD:
Bears are dealing successfully with all their tasks so far but today they will have to act more aggressively. Weak data from the eurozone and Germany may put the pair under pressure, which may again push it below the support area of 1.0415. This is exactly what bears need to maintain the current downtrend. The best scenario will be to sell the pair in the first half of the day after its rise prompted by the strong macroeconomic data and a false breakout at 1.0460. This will create a sell signal with a possible reversal towards 1.0415. A breakout and consolidation below this level and its retest from the bottom up will generate an additional signal to sell the pair. A strong downward movement of the pair towards 1.0369 will trigger stop-loss orders set by the buyers. A breakout and a retest from the bottom up of the 1.0369 level will validate the continuation of the bearish trend with the immediate target at 1.0321. This is where I recommend closing short positions. The further target will be the level of 1.0255. If EUR/USD develops an uptrend in the European session and there will be no bears at the level of 1.0460, bulls will regain control of the market. In this case, I would wait until the price reached a more attractive level of 1.0493, and only then would I open short positions. The formation of a false breakout will serve as a new pivot point for developing a downside correction. You can sell EUR/USD right after a rebound from the high of 1.0525, or even higher from 1.0568, keeping in mind a possible downside correction of 30-35 pips.
COT report
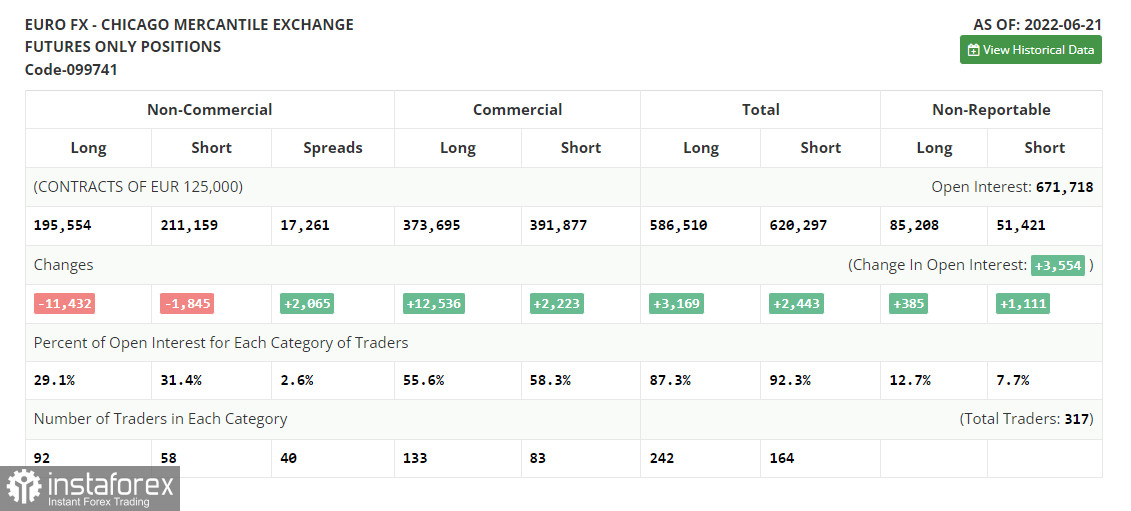
The COT report for June 21 recorded a reduction in both long and short positions. This led to the formation of a large negative delta which indicates the persistence of the bearish sentiment. Last week, Fed Chair Jerome Powell confirmed the plans of the regulator to continue rate hikes in an attempt to fight the highest inflation in the past 40 years. The European Central Bank also intends to raise the rates next month which may act as a limiting factor for the US dollar. Given that risk assets have been largely oversold lately, the euro has a good chance of recovery as soon as the ECB starts its monetary tightening. The COT report shows that the number of long positions of the non-commercial group of trades decreased by 11,432 to 195,554, while short positions of the same category dropped by 1,845 to 211,159. On the one hand, a cheaper euro is more attractive for traders, but they can return to the US dollar at any moment. The reason for this will be persistent record-high inflation and the need to take more aggressive steps by central banks. By the end of the week, the total non-commercial net position remained in the negative zone and declined to - 15,605 from - 6,018. The weekly closing price rose from 1.0481 to 1.0598.
Indicator signals:
Moving Averages
Trading near the 30 and 50-day moving averages indicates market uncertainty.
Please note that the time period and levels of the moving averages are analyzed only for the H1 chart, which differs from the general definition of the classic daily moving averages on the D1 chart.
Bollinger BandsIn case of a decline, the lower band of the indicator around 1.0415 will act as support. If the price moves up, the upper band of the indicator at 1.0460 will serve as resistance.
Description of indicators:
• A moving average of a 50-day period determines the current trend by smoothing volatility and noise; marked in yellow on the chart;• A moving average of a 30-day period determines the current trend by smoothing volatility and noise; marked in green on the chart;• MACD Indicator (Moving Average Convergence/Divergence) Fast EMA with a 12-day period; Slow EMA with a 26-day period. SMA with a 9-day period;• Bollinger Bands: 20-day period;• Non-commercial traders are speculators such as individual traders, hedge funds, and large institutions who use the futures market for speculative purposes and meet certain requirements;• Long non-commercial positions represent the total number of long positions opened by non-commercial traders;• Short non-commercial positions represent the total number of short positions opened by non-commercial traders;• The total non-commercial net position is the difference between short and long positions of non-commercial traders.
InstaForex analytical reviews will make you fully aware of market trends! Being an InstaForex client, you are provided with a large number of free services for efficient trading.

