 Stay
Stay 
Trading Conditions
Products
Tools


Monday was traditionally accompanied by an empty macroeconomic calendar. Important statistics in Europe, the UK, and the United States were not released. Traders worked based on technical analysis.
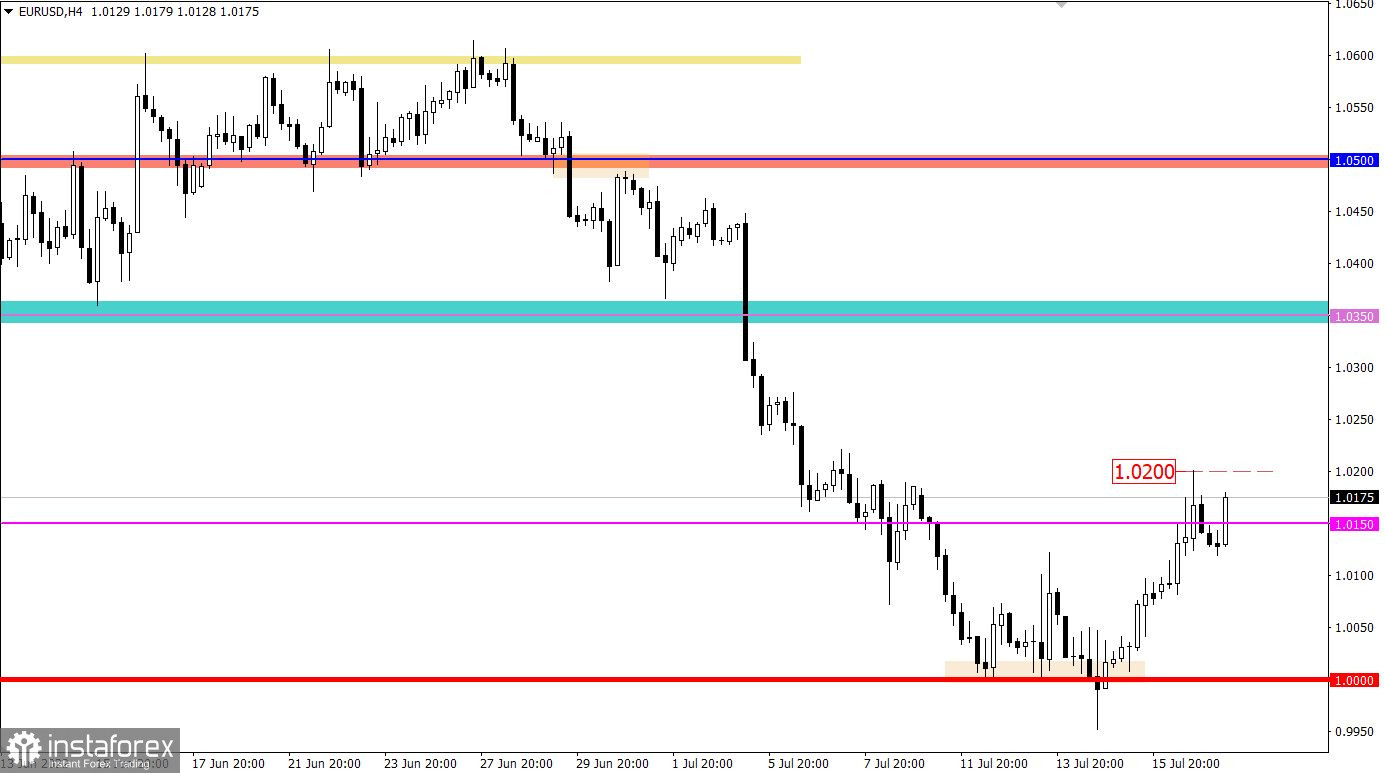
The EUR/USD currency pair strengthened by more than 200 points from the local low of the downward trend. Despite the scale of price changes, the euro is still oversold in the medium term, indicated by a number of historical values in which the quote is currently located.
On the trading chart of the daily period, there is an inconspicuous price rebound from the parity level area. The downward interest in the structure of the medium-term trend is still considered the main direction.
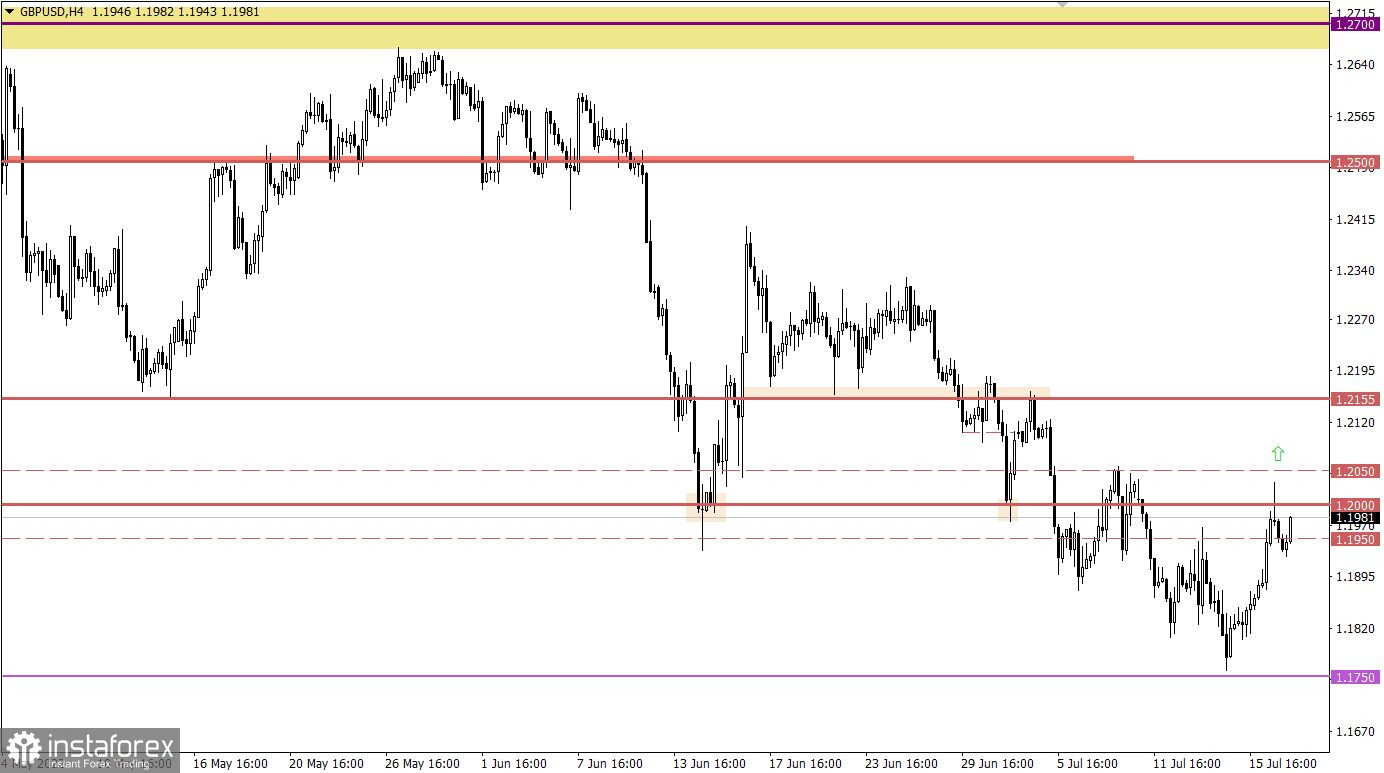
The GBPUSD currency pair returned to the psychological level of 1.2000 during the corrective movement (1.1950/1.2000/1.2050 ), which led to a reduction in the volume of long positions. As a result, there was a slowdown in the upward cycle in the market, where the 1.2000 level area is considered by traders as resistance.
With the opening of the European session, the UK labor market data were published, where unemployment remained at the same level of 3.8%. Forecasts expect growth of 3.9%. Employment in the country increased by 296,000, while claims for unemployment benefits in June decreased by 20,000.
Data on the UK is not bad, in fact, it became a catalyst for holding long positions on the pound sterling.
Tuesday's main event is the EU inflation data, which may pressure the market, provoking speculators to new actions. The inflation rate is expected to set a new growth record from 8.1% to 8.6%, so there can be no talk of any reduction in inflationary pressure.
Time targeting
EU inflation - 09:00 UTC
The volume of long positions decreased locally at the moment of touching the level of 1.0150, as indicated by the price stagnation-pullback. For the subsequent growth in the value of the euro, it is necessary to stay above 1.0200. Otherwise, there may be a gradual recovery of dollar positions with the price returning to the parity level.
In this situation, there are two possible scenarios to consider:
The first scenario is based on the strategy of price rebound from the area of an important level. In this case, the correction will complete the formation by successively returning the quote to the recent local low.
The second scenario considers a prolonged correction if the price holds above 1.2060 in a four-hour period. In this scenario, the pound sterling may strengthen to 1.2150
A candlestick chart view is graphical rectangles of white and black light, with sticks on top and bottom. When analyzing each candle in detail, you will see its characteristics of a relative period: the opening price, closing price, and maximum and minimum prices.
Horizontal levels are price coordinates, relative to which a stop or a price reversal may occur. These levels are called support and resistance in the market.
Circles and rectangles are highlighted examples where the price of the story unfolded. This color selection indicates horizontal lines that may put pressure on the quote in the future.
The up/down arrows are the reference points of the possible price direction in the future.
InstaForex analytical reviews will make you fully aware of market trends! Being an InstaForex client, you are provided with a large number of free services for efficient trading.

