 Stay
Stay 
Trading Conditions
Products
Tools


Long-term perspective.
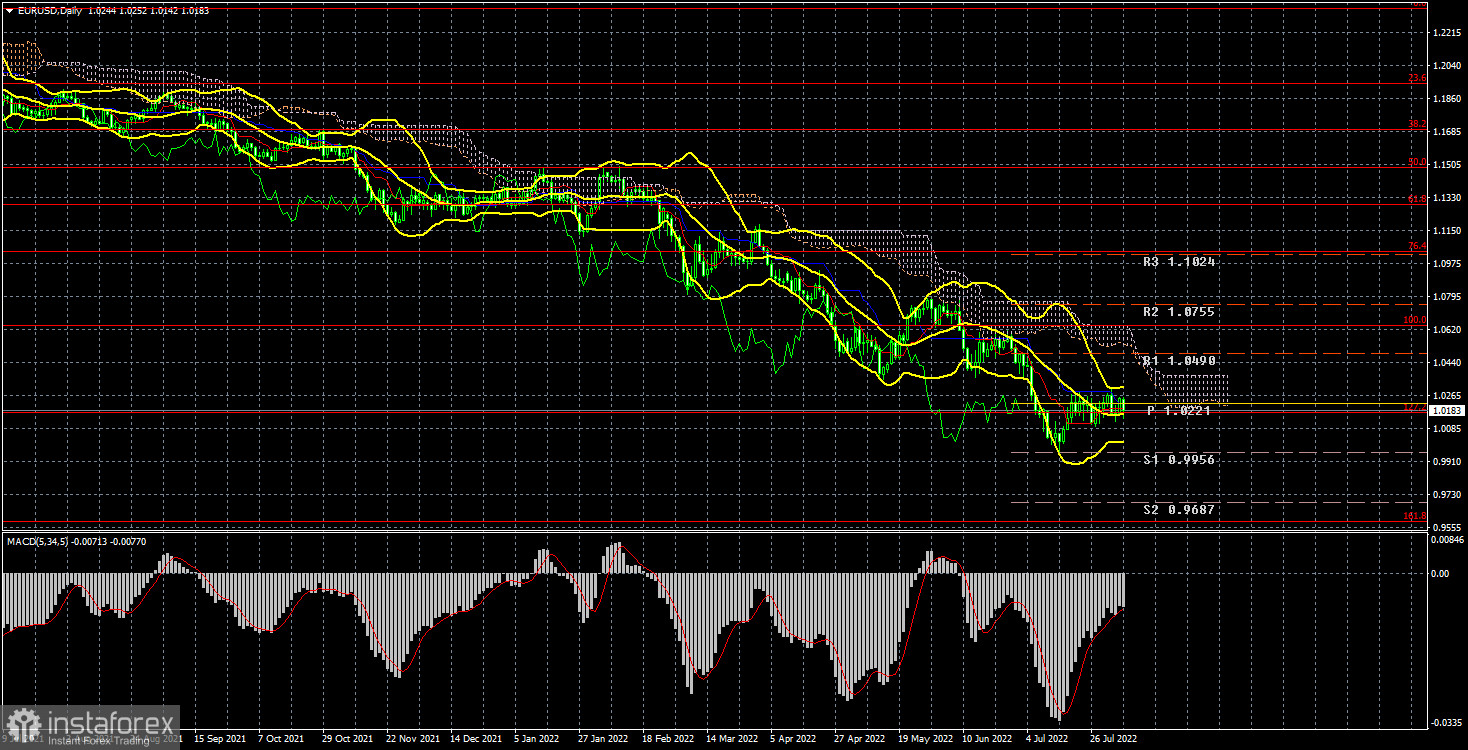
The EUR/USD currency pair has lost about 40 points during the current week. In our daily articles, we are already tired of writing that the pair is inside the side channel every day. Now, this channel is visible even on the 24-hour TF. The price managed to rise in half to the critical line, and the supply of buyers has dried up. For more than three weeks in a row, the price has not overcome the Kijun-sen line, although an upward correction would be quite logical from a technical point of view. However, pushing through this line has not yet been possible, and the European currency continues to be located near its 20-year lows. And it's very strange.
Usually, when the price updates its multi-year lows or highs, the movement in the same direction either continues, or a strong correction begins. And now there is neither the first nor the second. It is obvious that before the quotes consolidate above the Kijun-sen line, the downward trend persists, and the fall of the euro can resume at any moment. It is also noteworthy that neither the ECB meeting nor the Fed meeting could pull the pair out of the flat. And what do we have in the end? The pair could technically continue to adjust, as the current pullback is weak. Fundamentally, the European currency has no reason to grow. Therefore, in principle, the price can move from the current position in any direction.
Another thing is that we do not expect strong growth, but a new strong fall is quite possible. And most importantly. On Thursday, we discussed that the nonfarm report in the US is likely to provoke a strong market reaction but will not help the pair to leave the side channel. And so it turned out. We want to note once again: that the pair may leave the flat unexpectedly on a day when there will be no macroeconomic or fundamental events.
COT analysis.
Over the past six months, COT's reports on the euro currency have raised many questions. The illustration above clearly shows that for most of 2022, they showed a "bullish" mood of professional players, but at the same time, the European currency was falling. The situation has changed, but not in favor of the euro currency. If earlier the mood was "bullish" and the euro currency was falling, now the mood is "bearish," and the euro currency is also falling. Therefore, we do not see any reason for the growth of the euro because the absolute majority of factors remain against it. During the reporting week, the number of buy contracts decreased by 6.3 thousand, and the number of shorts from the "Non-commercial" group - by 9.1 thousand. Accordingly, the net position has increased by about 3 thousand contracts, which is a minuscule change. The mood of the major players remains "bearish," and it has constantly been increasing in recent weeks. From our point of view, this fact very eloquently indicates that at this time, even professional traders do not believe in the euro currency. The number of buy contracts is lower than sell contracts for non-commercial traders by 39 thousand. Therefore, we can state that not only the demand for the US dollar remains high, but also the demand for the euro is quite low. It may lead to an even greater fall in the euro currency. Over the past six months or a year, the euro currency has not been able to show even a tangible correction, let alone something more. The maximum upward movement was about 400 points. Over the past three weeks, the pair has adjusted by 300 points.
Analysis of fundamental events.
The key event this week was the Nonfarm Payrolls report in the USA. For most of the week, nothing was interesting in the calendars of events of the European Union and the United States. We can only note the ISM business activity index, which unexpectedly rose to 56.7, while the similar S&P index fell to 47.3. A very strange divergence in the US service sector. But on Friday, American statistics pleased the euro/dollar pair sellers. It turned out that not only the nonfarm report for July exceeded the forecast by two times, not only the last report for June was revised upward, but also the unemployment rate decreased from 3.6% to 3.5%, and wages rose stronger than forecast. Based on this data, the US dollar rose by 90 points in half an hour and remained inside the side channel, where it has been trading for more than three weeks. And that's all traders need to know and understand about the movement of the euro/dollar pair at this time.
Trading plan for the week of August 8–12:
1) On the 24-hour timeframe, the pair continues to trade near its 20-year lows. Almost all factors still support the long-term growth of the US dollar. Traders failed to overcome the Ichimoku cloud, so the upward movement and purchases of the euro currency are still irrelevant. It is necessary to wait, at least, for consolidation above the Senkou Span B line and only after that to consider long positions.
2) The sales of the euro/dollar pair are still more relevant now. The price has adjusted to the critical line, but until it is overcome, the downward trend remains the same, and the rebound from this line can be used as a sell signal with a target of 0.9582 (161.8% Fibonacci).
Explanations of the illustrations:
Price levels of support and resistance (resistance /support), Fibonacci levels – levels that are targets when opening purchases or sales. Take Profit levels can be placed near them.
Ichimoku indicators(standard settings), Bollinger Bands(standard settings), MACD(5, 34, 5).
Indicator 1 on the COT charts is the net position size of each category of traders.
Indicator 2 on the COT charts is the net position size for the "Non-commercial" group.
InstaForex analytical reviews will make you fully aware of market trends! Being an InstaForex client, you are provided with a large number of free services for efficient trading.


