 Stay
Stay 
Trading Conditions
Products
Tools


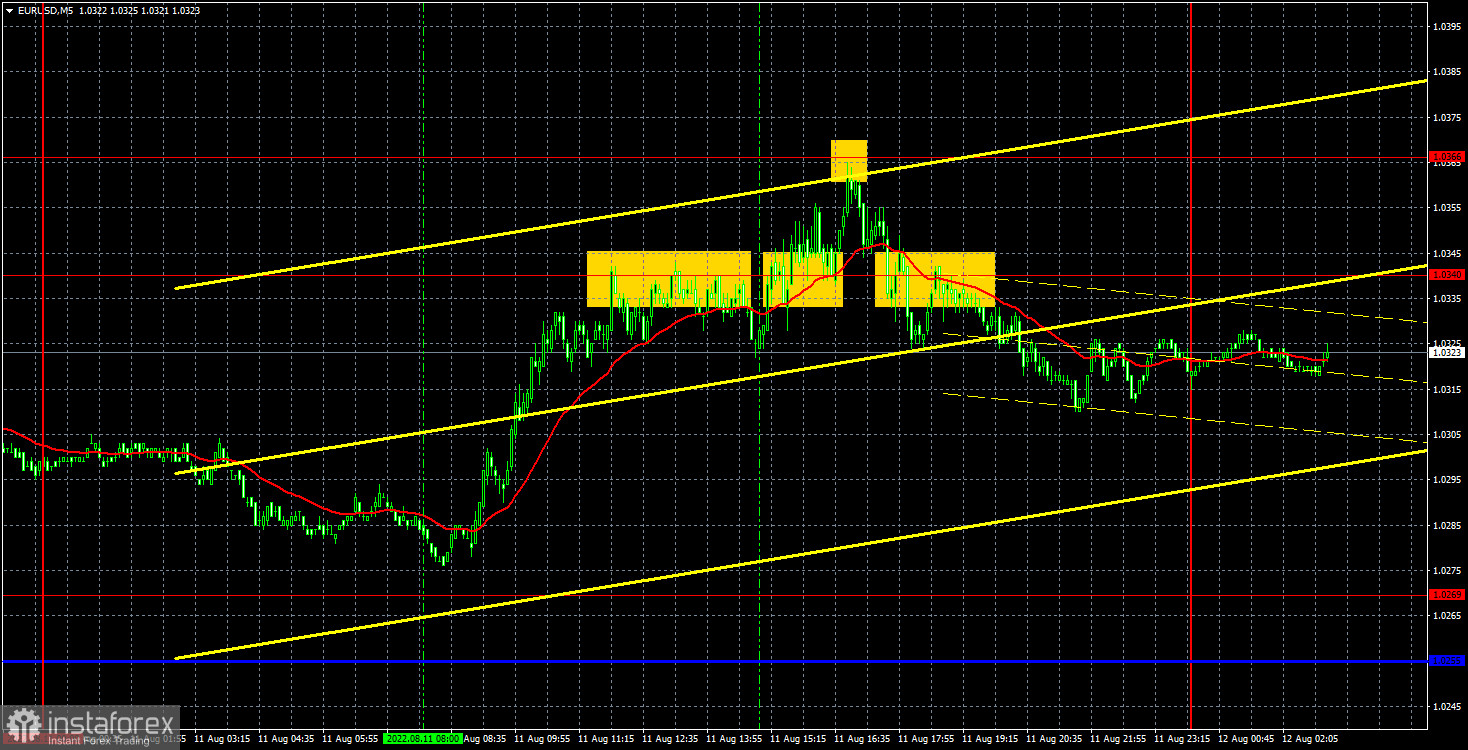
The EUR/USD pair tried to continue the growth on Thursday, which began on Wednesday immediately after the release of the US inflation report. But this time, the latest high was not updated, and the price got stuck for the second time near the level of 1.0366. Nevertheless, during the day, almost out of the blue, the euro added about 90 points. This is a very good result, given the fact that today there was not a single important report or event in either the US or the EU. The euro's growth showed that the bulls are ready to fight for a new upward trend, but still their strength is not unlimited - the euro needs a very specific fundamental and macroeconomic support. Without it, it will be quite difficult for the pair to continue growing. And to be more precise, we don't think at all that the pair is capable of breaking the one and a half year trend due to one inflation report. There is, of course, a feeling that the mood in the market is changing at this time, but this is just a hypothesis. We have formed an ascending trend line, which serves as a good guide for bulls.
Everything was not very good with trading signals on Thursday. A strong buy signal could have formed at the opening of the European trading session, but the price did not reach the level of 1.0269 by only 6 points. But near the levels of 1.0340 and 1.0366, where the upward movement, in fact, ended, four absolutely inaccurate and fuzzy signals were formed. There were a lot of problems with these signals, since the levels 1.0340 and 1.0366 could be considered as an area. Then the signals would be many times less. In any case, we believe that traders could have opened at least one short position, which resulted in a slight loss.
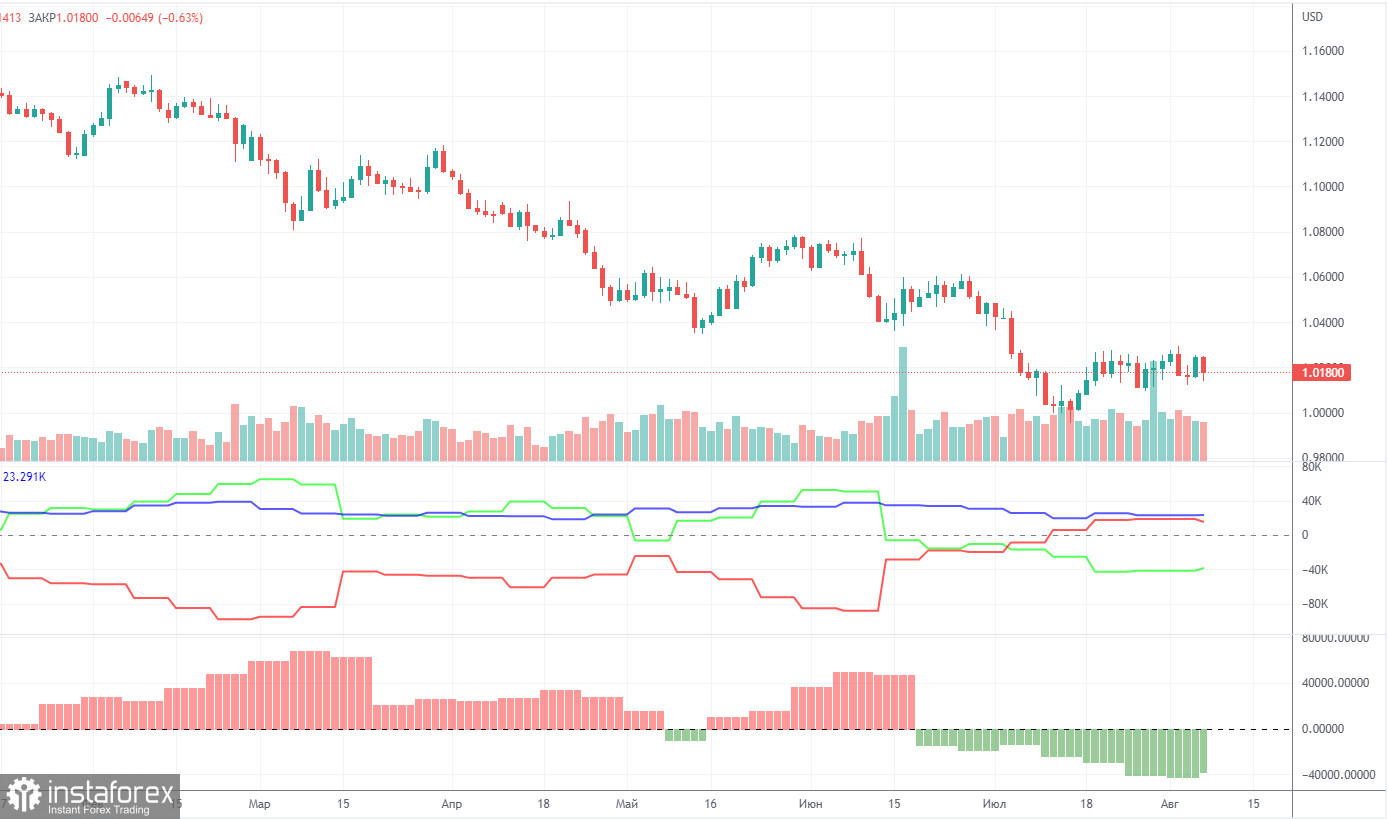
The Commitment of Traders (COT) reports on the euro over the past six months have raised a huge number of questions. The chart above clearly shows that for most of 2022 they showed an open bullish mood of professional players, but at the same time, the euro was falling at the same time. At this time, the situation has changed, but NOT in favor of the euro. If earlier the mood was bullish, and the euro was falling, now the mood is bearish and... the euro is also falling. Therefore, for the time being, we do not see any grounds for the euro's growth, because the vast majority of factors remain against it. During the reporting week, the number of long positions decreased by 6,300, while the number of shorts in the non-commercial group decreased by 9,100. Accordingly, the net position increased by about 3,000 contracts, which is a meager change. The mood of the big players remains bearish and has steadily intensified in recent weeks. From our point of view, this fact very eloquently indicates that at this time even commercial traders do not believe in the euro. The number of longs is lower than the number of shorts for non-commercial traders by 39,000. Therefore, we can state that not only the demand for the US dollar remains high, but also the demand for the euro is quite low. This may lead to a new, even greater fall of the euro. Over the past six months or a year, the euro has not been able to show even a tangible correction, not to mention something more. The highest upward movement was about 400 points. Over the past three weeks, the pair has managed to correct by 300 points.
Overview of the EUR/USD pair. August 12. The ECB seeks to keep countries with weak economies afloat.
Overview of the GBP/USD pair. August 12. The pound hid in a tiger pose ahead of the UK GDP report.
Forecast and trading signals for GBP/USD on August 12. Detailed analysis of the movement of the pair and trading transactions.
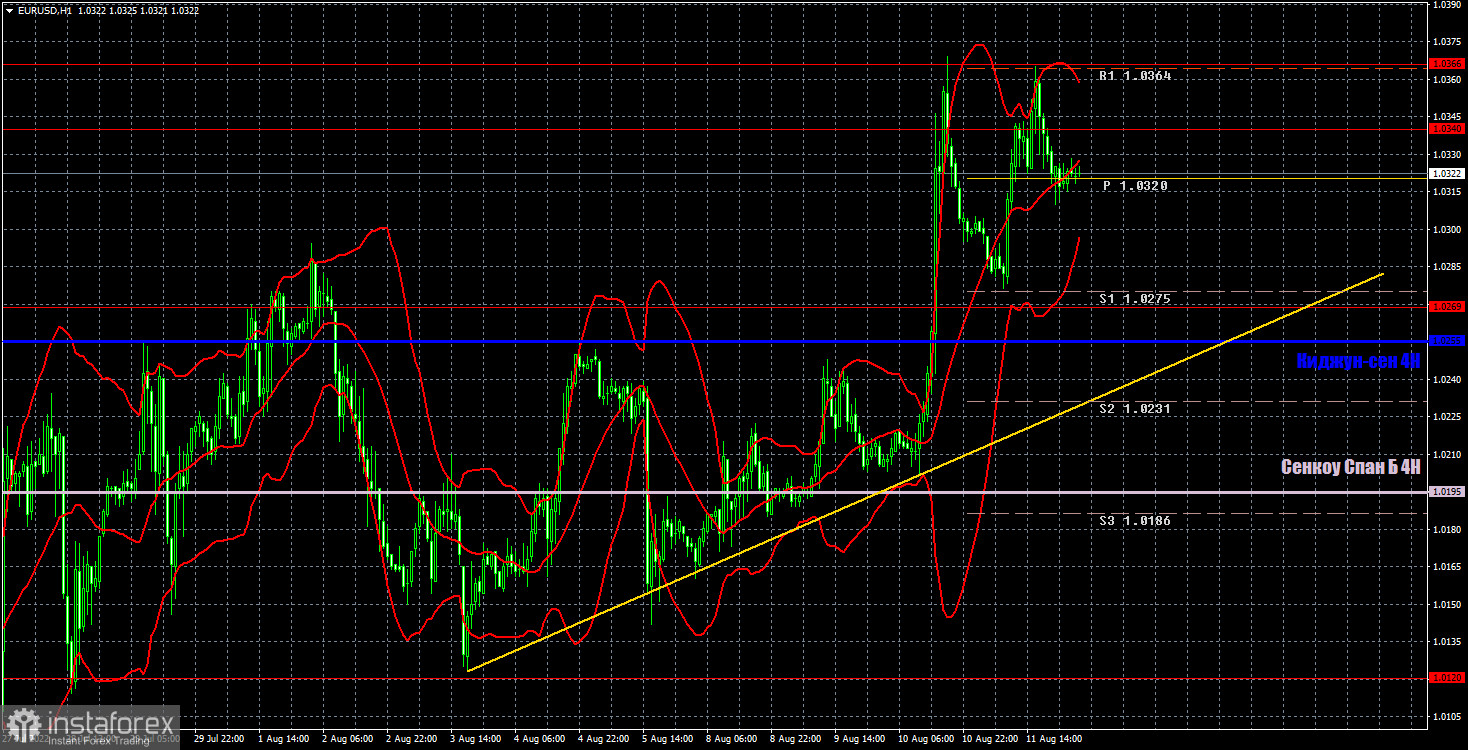
The pair finally broke out of the horizontal channel 1.0120-1.0269 on the hourly timeframe. Therefore, the flat has been completed so far and we can already talk about an upward trend, since a trend line has been formed. Nevertheless, nothing prevents the pair from consolidating below it tomorrow, as it does not have enough fundamental grounds for continued growth. We highlight the following levels for trading on Friday - 1.0120, 1.0269, 1.0340-1.0366, 1.0485, 1.0579, as well as Senkou Span B (1.0195) and Kijun-sen (1 .0255). Ichimoku indicator lines can move during the day, which should be taken into account when determining trading signals. There are also secondary support and resistance levels, but no signals are formed near them. Signals can be "rebounds" and "breakthrough" extreme levels and lines. Do not forget about placing a Stop Loss order at breakeven if the price has gone in the right direction for 15 points. This will protect you against possible losses if the signal turns out to be false. One more or less significant report will be published in the European Union and the United States on August 12. This is industrial production in the EU; And the consumer sentiment index in the US. Both can be easily and simply ignored by traders.
Support and Resistance Levels are the levels that serve as targets when buying or selling the pair. You can place Take Profit near these levels.
Kijun-sen and Senkou Span B lines are lines of the Ichimoku indicator transferred to the hourly timeframe from the 4-hour one.
Support and resistance areas are areas from which the price has repeatedly rebounded off.
Yellow lines are trend lines, trend channels and any other technical patterns.
Indicator 1 on the COT charts is the size of the net position of each category of traders.
Indicator 2 on the COT charts is the size of the net position for the non-commercial group.
InstaForex analytical reviews will make you fully aware of market trends! Being an InstaForex client, you are provided with a large number of free services for efficient trading.

