 Stay
Stay 
Trading Conditions
Products
Tools


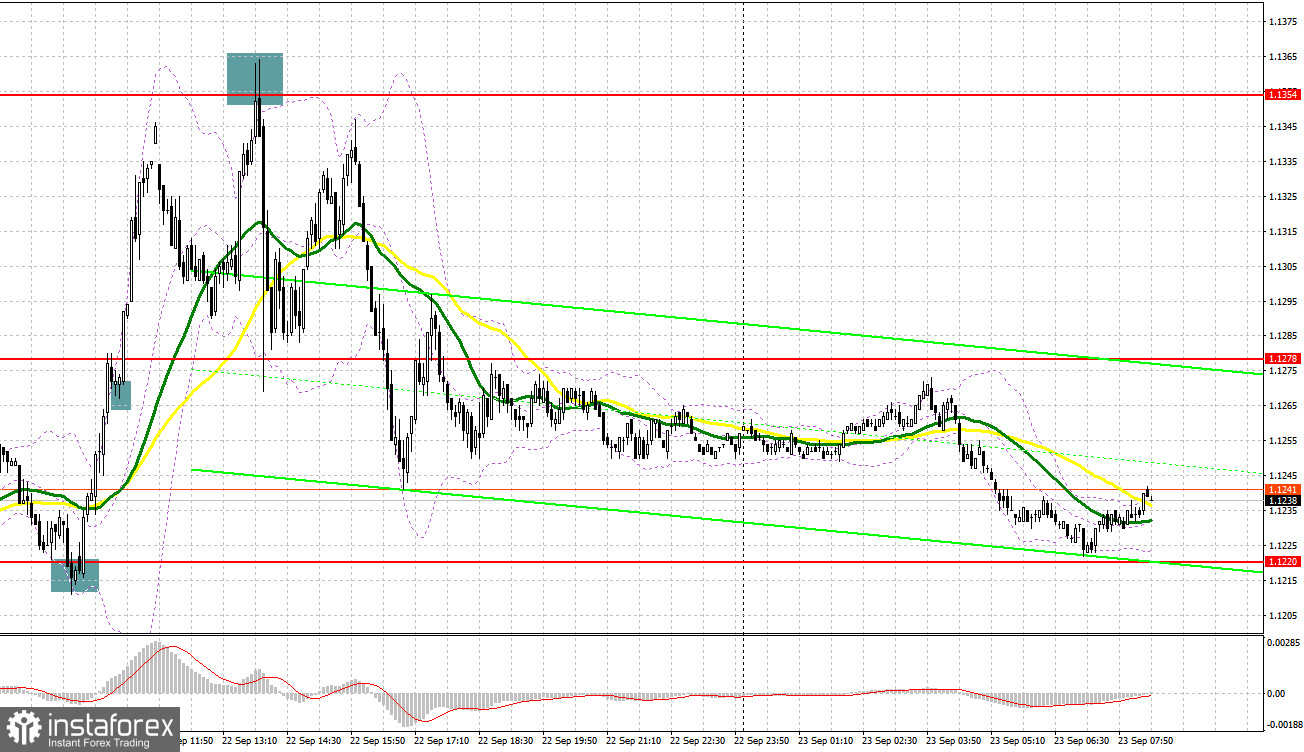
Yesterday, GBP/USD created a few excellent market entry signals. Now let's take a look at the 5-minute chart and try to figure out what actually happened. In the morning article, I turned your attention to 1.1220 and 1.1268 and recommended making trading decision with these levels in focus. A false breakout at 1.1220 generated an excellent buy signal for GBP/USD which enabled a significant growth of more than 40 pips. Then, the price settled above 1.1268 and made the opposite test downwards, this making an extra market entry point for long positions. By the moment of writing this article, the pair had grown more than 80 pips. In the second half of the day, the instrument made a false breakout at around 1.1354 in light of the Bank of England's rate hike. This price action generated a nice sell signal and pushed the price down to 1.1278 which helped us earn almost 70 pips.
What is needed to open long positions on GBP/USD
The Bank of England's policy decision affected GBP significantly, thus pushing it down to one-year lows. Apparently, the regulator is ready to sacrifice economic growth for its victory over high inflation. Shortly after, the market will get to know the UK PMIs which are expected to prove sluggish business activity in September and to confirm the side effect of the Bank of England's policy. Experts at Markit Economics will provide preliminary PMIs on the UK manufacturing, service sector, and the composite PMI. The services PMI could have remained above 50 and logged modest growth.
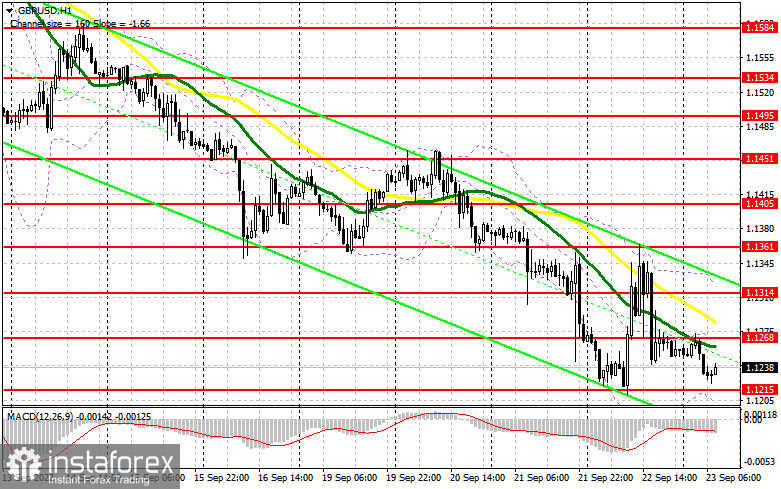
In case GBP declines following this data, the buyers will have to enter the market at about 1.1215, the one-year low. Only a false breakout there will provide a buy signal with the aim of the price recovery to resistance at 1.1268. A breakout and the test downwards like in yesterday's session could activate the sellers' stop losses and generate a new buy signal with the upward target at 1.1314. A higher target is seen at 1.1361 where I recommend setting a take profit. In case GBP/USD falls and the buyers do not enter the market at 1.1215 which is the most realistic scenario the currency pair will come under pressure again. The door will be open to a lower low of 1.1168. I would advise you to open long positions immediately at a dip from 1.1113 or lower at about 1.1065, bearing in mind a 30-35 intraday upward correction.
What is needed to open short positions on GBP/USD The bears are holding the upper hand in the market. Their new task is to settle below a one-year low at around 1.1215. The more reasonable bearish scenario will be a false breakout at 1.1268. The price could move towards this level after the publication of the UK PMIs. Only the services PMI might help GBP regain its footing because other PMIs are expected to be downbeat. In this case, we might reckon GBP/USD will decline again to 1.1215 and break this level. The opposite test of 1.1215 upwards will suggest a nice entry point for opening sell positions as we foresee a new massive sell-off at around 1.1168. The lowest target is seen at 1.1113 where I recommend profit-taking. In case GBP/USD grows and bears do not assert themselves at 1.1268, GBP could climb to 1.1314 during the upward correction. Moving averages are crossing 1.1314, playing in the sellers' favor. Only a false breakout at that level will provide a nice market entry point for short positions as we foresee a further decline. In case of sluggish trading there, I recommend selling GBP/USD immediately at a rally from 1.1316, bearing in mind a 30-35 drop intraday.
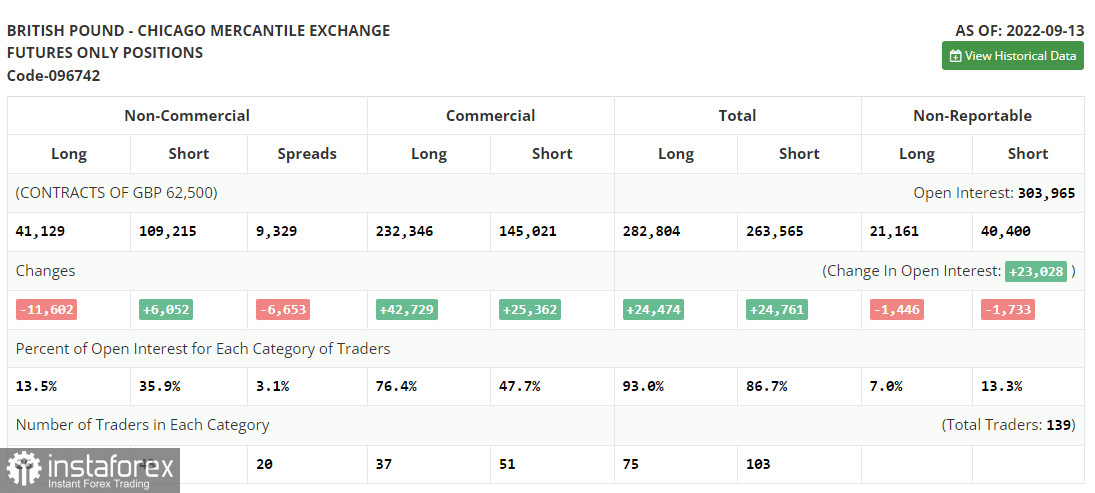
The COT (Commitment of Traders) report from September 13 logs an increase in short positions and a contraction in long ones. This confirms that GBP has got stuck in a nosedive and it is complicated to escape from it. This week, apart from the US Fed, other major central banks are holding policy meetings, including the Bank of England. The regulator has already announced the rate hike of 50 basis points to 2.25%, thus having increased interest rates 7 times. A long series of sharp rate hikes is pushing the domestic economy into a recession.
Fresh macroeconomic data exposes ailing economic conditions in the Kingdom. The recent speech by Bank of England Governor Andrew Bailey underscored the aggressive MPC's agenda. The central bank is facing a dilemma. On the one hand, raising interest rates should prop up the sterling. On the other hand, such measures assure traders to get rid of GBP amid a sharp slowdown in economic growth and the cost-of-living crisis. Traders are betting on the US dollar's strength as a safe haven asset. Besides, high interest rates in the US also attract investors, thus boosting demand for USD. According to the last COT report, long non-commercial positions dropped by 11,602 to 41,129 whereas short non-commercial ones rose by 6,052 to 109,215. As a result, the negative delta of the non-commercial net positions grew to -68,086 against -50,423. GBP/USD closed last week sharply lower at 1.1504 against 1.1526 s week ago.
Indicators' signals:
Trading is carried out below the 30 and 50 daily moving averages. It means a further bearish trend.
Moving averages
Note: The period and prices of moving averages are considered by the author on the H1 hourly chart and differ from the general definition of the classic daily moving averages on the daily D1 chart.
Bollinger Bands
If GBP/USD grows, the indicator's upper border at 1.1314 will serve as resistance.
Description of indicators
InstaForex analytical reviews will make you fully aware of market trends! Being an InstaForex client, you are provided with a large number of free services for efficient trading.

