 Stay
Stay 
Trading Conditions
Products
Tools


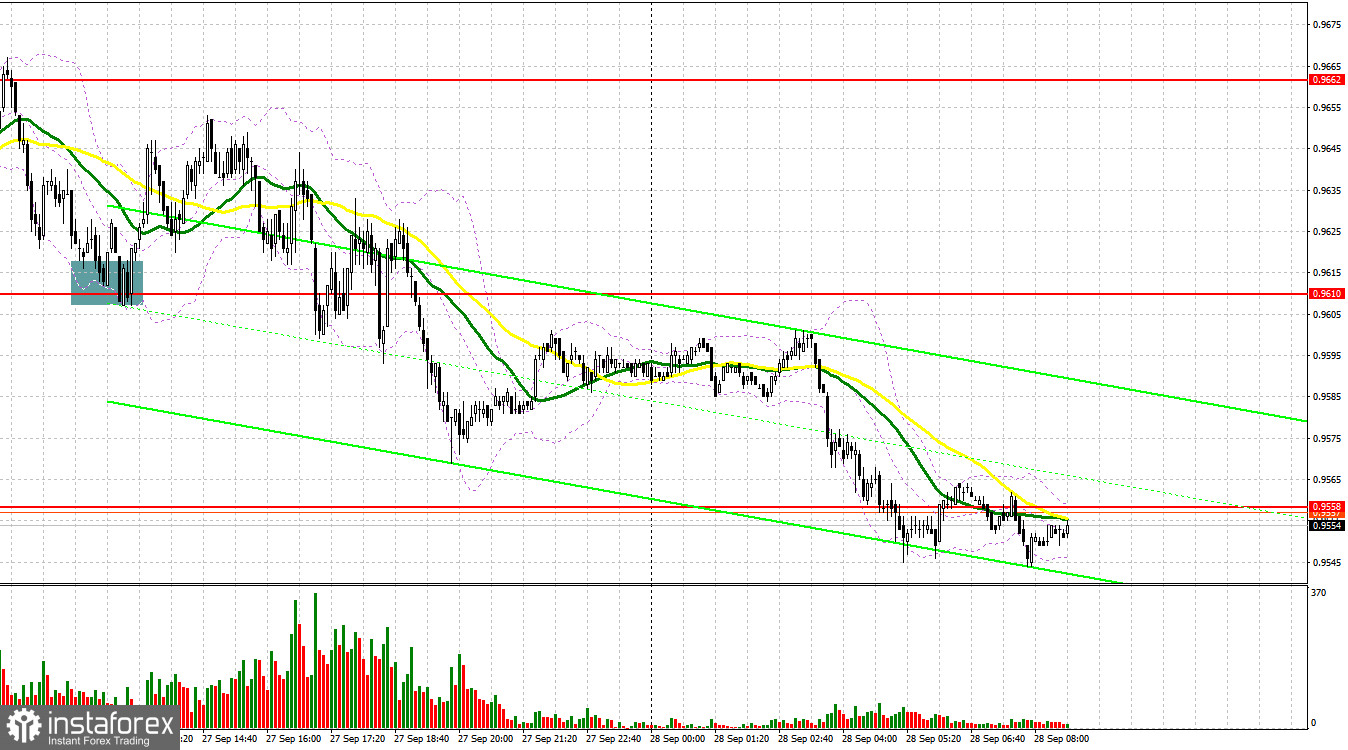
Yesterday, traders received just one signal to enter the market. Let us take a look at the 5-minute chart to clear up the market situation. Earlier, I asked you to pay attention to the level of 0.9620 to decide when to enter the market. Bears' failure to break below this level caused by the absence of fundamental data as well as a false breakout led to a perfect buy signal. The pair jumped by more than 35 pips, but then pressure returned. The price failed to hit the nearest resistance level. In the second part of the day, there were no good signals to enter the market.
Conditions for opening long positions on EUR/USD:
Yesterday, the US published strong data on the consumer confidence index, thus boosting demand for the greenback. Today, during the Asian trade, the pair hit fresh yearly lows. In the first part of the day, there is no macroeconomic report that may stop the pair's drop. Only Germany will disclose its consumer climate data that will hardly show any improvements. Comments that will be provided by Christine Lagarde and Frank Elderson, a member of the Executive Board of the European Central Bank, are unlikely to encourage buyers. The fact is that since Monday, representatives of the ECB have been saying the same thing. That is why their speeches will hardly contain any new information. Against the backdrop, traders should be cautious when opening long positions. It will be possible to go long only after a false breakout of 0.9509. The target will be located at this year's low of 0.9556. A breakout and a downward test of this level as well as strong data from Germany may affect bears' stop orders, forming an additional buy signal with the target at 0.9598. There, we can see sellers' moving averages. The next target is the resistance level of 0.9647, where it is recommended to lock in profits. If the euro/dollar pair continues falling and bulls fail to protect 0.9509, pressure on the pair will increase, thus prolonging the downtrend. Positive data from the US may push the euro to fresh lows. In this case, traders should go long after a false breakout of 0.9458. It is also possible to initiate buy orders after a bounce off 0.9407 or lower – from 0.9370, expecting a rise of 30-35 pips.
Conditions for opening short positions on EUR/USD:
Bears are controlling the market and now they should do their best to keep control over the level of 0.9556. If Germany discloses weak data, the price may show a false breakout of this level, thus forming a sell signal on yearly lows. This may push the price even deeper to 0.9509. A breakout, settlement, and an upward test will give an additional signal to sell the euro. If this scenario comes true, bears will affect bulls' stop orders, thus spurring a drop to 0.9458. The next target is located at 0.9407, where it is recommended to lock in profits. If the euro/dollar pair jumps during the European session and bears fail to protect 0.9556, demand for the euro will rise, thus boosting the upward correction. Thus, traders should avoid sell orders. If the euro rises, it will have a chance to test the resistance level of 0.9598, where there are sellers' MAs. In this case, traders could go short after a false breakout. It is also possible to sell the asset just after a rebound from the high of 0.9467 or even higher – from 0.9699, expecting a decline of 30-35 pips.
COT report
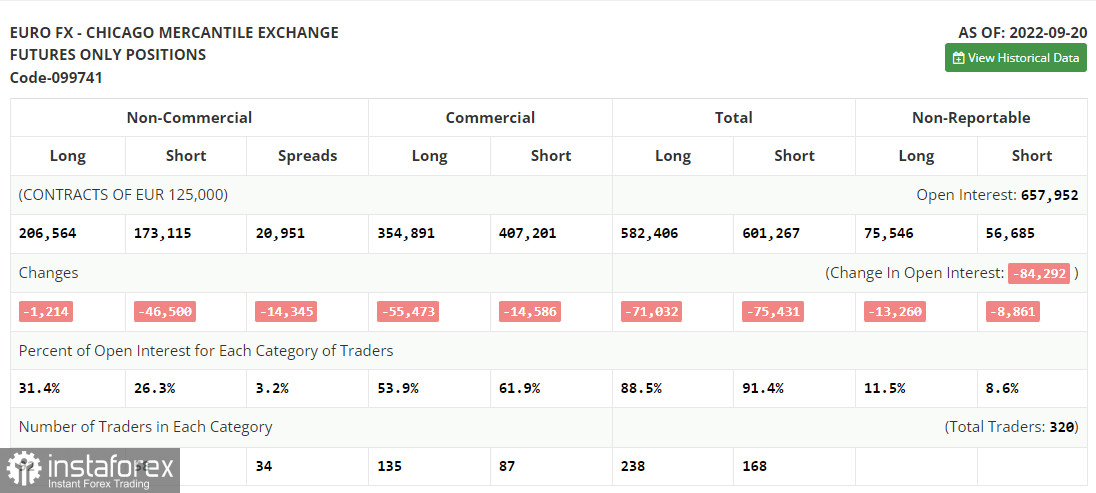
According to the COT report from September 20, the number of both long and short positions dropped. The data reflects the ECB's meeting in September and a sharp rise in the key interest rate of 0.75%. However, the Fed's meeting took place a bit later and failed to affect the report. Notably, the Federal Reserve also raised the benchmark rate by 75 basis points and maintained the gap between the interest rates of the central banks. As a result, pressure on the euro increased. In general, the current economic situation in the eurozone is affecting the euro, which has already dropped to 0.95 and has no reason to recover. A worsening geopolitical situation in the world has a significant influence on the eurozone. It may greatly slacken the European economy in autumn and winter. Against the backdrop, the economy may slip into recession as early as spring of 2023. That is why in the mid-term, the euro will hardly gain in value. Even though the US publishes weak fundamental data, investors will still prefer safe-haven assets, including the greenback. The COT report unveiled that the number of long non-commercial positions dropped by 1,214 to 206,564, whereas the number of short non-commercial positions slumped by 46,500 to 173,115. At the end of the week, the total non-commercial net position became positive and increased from -11,832 to 33,449. This indicates that investors have benefited from the situation and continued to buy the cheap euro, thus accumulating long positions. They hope that the crisis will end soon. The weekly closing price rose to 1.0035 from 0.9980.
Signals of indicators:
Moving Averages
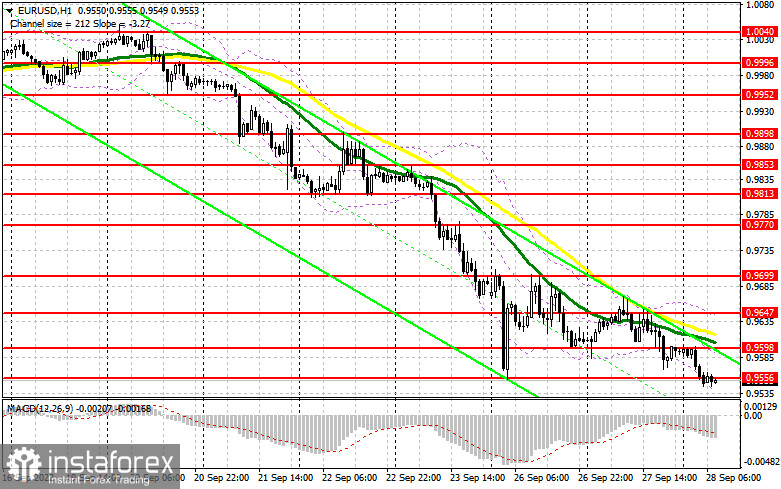
Trading is performed below the 30- and 50-day moving averages, which points to the bearish trend.
Note: The period and prices of moving averages are considered by the author on the one-hour chart, which differs from the general definition of the classic daily moving averages on the daily chart.
Bollinger Bands
If the pair increases, the resistance level will be located at 0.9647, the upper limit of the indicator.
Description of indicators
InstaForex analytical reviews will make you fully aware of market trends! Being an InstaForex client, you are provided with a large number of free services for efficient trading.


