 Stay
Stay 
Trading Conditions
Products
Tools


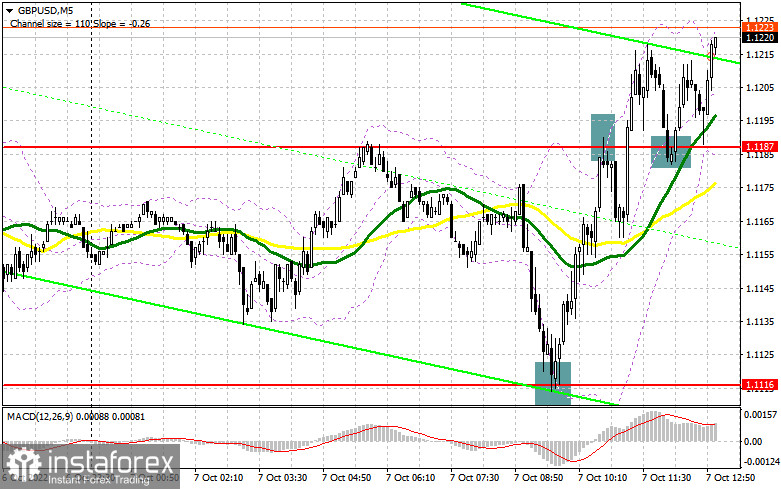
In my morning review, I outlined two levels of 1.1116 and 1.1187 and recommended entering the market from there. Let's first analyze the 5-minute chart. As the pound was rapidly falling in the first half of the day, a false breakout at 1.1116 formed a great buy signal. As a result, the pair recovered back to 1.1187, thus generating around 70 pips in profit. A failure to settle above 1.1187 created a sell signal and a decline of just 30 pips. After that, the pound was back to the bull market. A breakout and a retest of 1.1187 serve as a signal to buy the pair which has already generated a 30-pip profit at the time of writing. The technical setup, as well as the trading strategy, has not changed much in the second half of the day.
For long positions on GBP/USD:
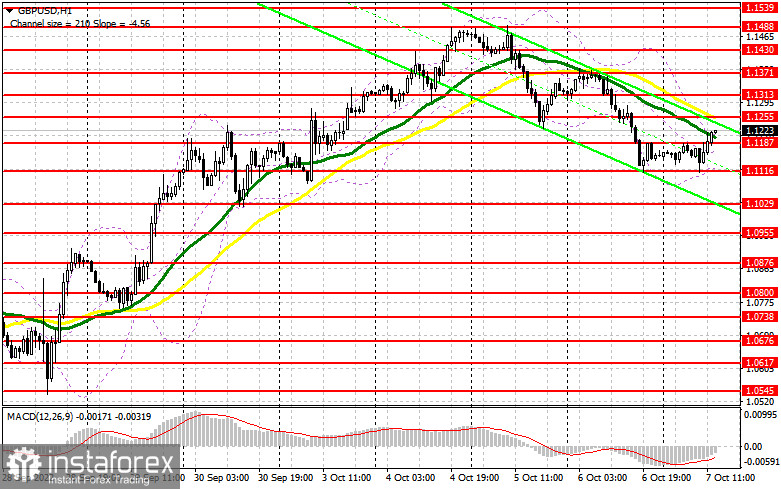
The further rise of the pound is limited by fundamental factors, and in particular, by macroeconomic reports from the US. If nonfarm payrolls show a rapid surge in the number of new jobs compared to the previous month, the US dollar will immediately strengthen as the Fed will continue to tighten monetary policy despite its adverse effect on the economy. On the other hand, a deep decline in the indicator will support the British pound and may validate the resumption of the rally that has been observed since September 28. When trading amid high volatility, you need to make decisions quickly as there is a risk to miss a reversal. If the pair declines, the best moment for going long will be a false breakout near the support level of 1.1116. This can be a good entry point, considering a possible return to the 1.1187 level. The moving averages that are currently limiting the pair's upside potential are located above this level. An upside correction meaning that bears are retreating will be possible only when the price breaks above the mentioned range. The level of 1.1255 will serve as the main target. Yet, if bulls are active after the news publication, this will be an interim level. The test of the resistance area of 1.1313 will be far more important as it will signal the defeat of sellers. At this point, I recommend profit taking. If GBP/USD depreciates amid hawkish comments by the Fed, and bulls are idle at 1.1116, the pound will come under more pressure. If so, I recommend going long only when the price reaches 1.1029. Buying will be possible only on a false breakout. You can open log positions right after a rebound from the level of 1.0955 or near the low of 1.0876, bearing in mind an intraday correction of 30-35 pips.
For short positions on GBP/USD:
The main task for bears is to regain control over the 1.1187 level before the publication of the US macroeconomic data. This will balance the market at least until the release of the US jobs data for September. An upward retest of the 1.1187 level will bring the pound back under pressure and may open the way for an extended downward correction with a possible breakout of the 1.1116 low. A breakout of this range will create a sell entry point with the downward target at 1.1029. The level of 1.0955 seems like a more attractive target where I recommend profit taking. However, such a big change in the price will be possible only if the data on the labor market is positive. If GBP/USD rises, bears will try to assert their strength near the resistance of 1.1255. In case no large market players appear at this point, bulls will be again in control of the market. If so, the pair may retest the high of 1.1313. A false breakout of this level will create an entry point for going short, considering a possible downside correction. If nothing happens there as well, the price may surge to 1.1371. I recommend selling the pair at his level right after a rebound, bearing in mind a downside pullback of 30-35 pips within the day.
COT report:
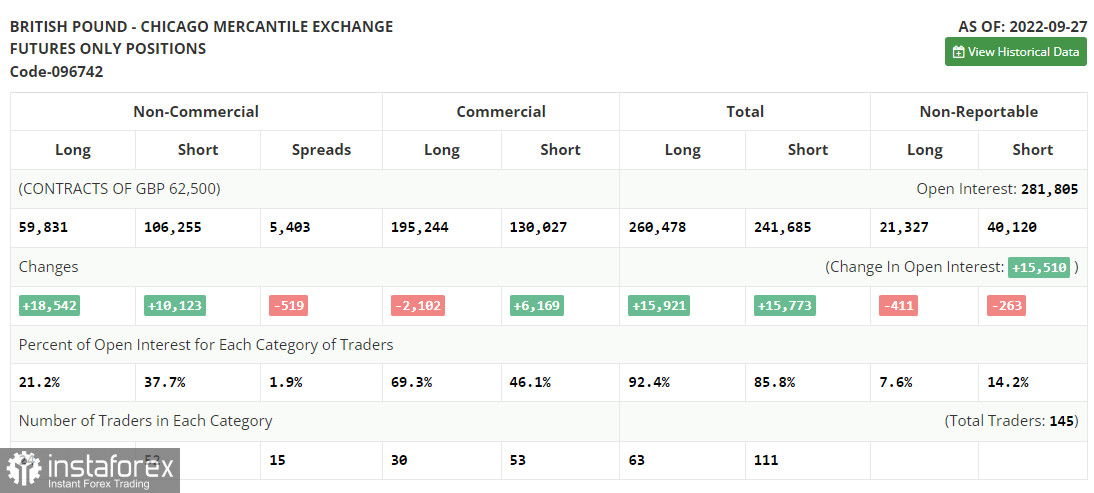
The Commitment of Traders report for September 27 showed a rapid rise in both long and short positions. The pound lost 10.0% in just two days, forcing the Bank of England to interfere. This explains the recovery of demand for the pound and the rise in long positions. As the Bank of England raised the rate by just 0.5%, the pound plummeted to record lows, making the scenario of hitting the parity level very real. Yet, the actions taken by the regulator in the bonds market helped steady the situation in the foreign exchange market and allowed bulls to recoup most of the losses. The question is how long these measures will keep the pound afloat. Next week, the business activity data expected in the UK may significantly weaken the pound and limit its upside potential. According to the latest COT report, long positions of the non-commercial group of traders went up by 18,831 to 59,831 while short positions jumped by 10,123 to 106,255. As a result, the total non-commercial net position decreased to -46,424 from -54,843. The weekly closing price plunged and stood at 1.0738 versus 1.1392.
Indicator signals:
Moving Averages
Trading below the 30- and 50-day moving averages indicates that bears attempt to regain control over the market.
Please note that the time period and levels of the moving averages are analyzed only for the H1 chart, which differs from the general definition of the classic daily moving averages on the D1 chart.
Bollinger Bands
In case of an upward movement, the upper band of the indicator at 1.1205. will serve as resistance.
Description of indicators:
• A moving average of a 50-day period determines the current trend by smoothing volatility and noise; marked in yellow on the chart;
• A moving average of a 30-day period determines the current trend by smoothing volatility and noise; marked in green on the chart;
• MACD Indicator (Moving Average Convergence/Divergence) Fast EMA with a 12-day period; Slow EMA with a 26-day period. SMA with a 9-day period;
• Bollinger Bands: 20-day period;
• Non-commercial traders are speculators such as individual traders, hedge funds, and large institutions who use the futures market for speculative purposes and meet certain requirements;
• Long non-commercial positions represent the total number of long positions opened by non-commercial traders;
• Short non-commercial positions represent the total number of short positions opened by non-commercial traders;
• The non-commercial net position is the difference between short and long positions of non-commercial traders.
InstaForex analytical reviews will make you fully aware of market trends! Being an InstaForex client, you are provided with a large number of free services for efficient trading.

