 Stay
Stay 
Trading Conditions
Products
Tools


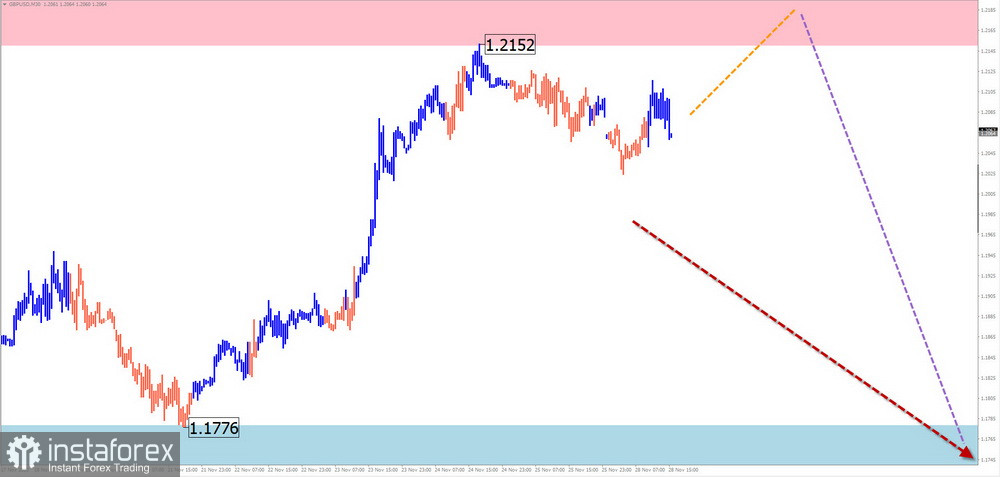
GBP/USD
Brief analysis
On the chart of the key British pound pair, a new upward trend began on September 26. Its current potential already exceeds the daily TF's scope. The price has reached a strong potential reversal zone's boundaries. Another adjustment to the wave's structure is required.
Forecast for the coming week:
The pair's price may experience pressure on the resistance zone at the start of the upcoming week. Its upper border could be punctured for a brief period. Following that, the price will reverse and move downward. The support zone displays the anticipated lower limit of the pair's weekly course.
Potential zones for reversals
Resistance:
- 1.2150/1.2200
Support:
- 1.1780/1.1730
Recommendations
Purchases: Within the parameters of individual sessions, limited purchases are possible. The calculated resistance establishes a ceiling on the potential.
Sales: After the appearance of the corresponding signals from the vehicles you use in the resistance area, sales may take over as the primary direction of transactions in the days to come.
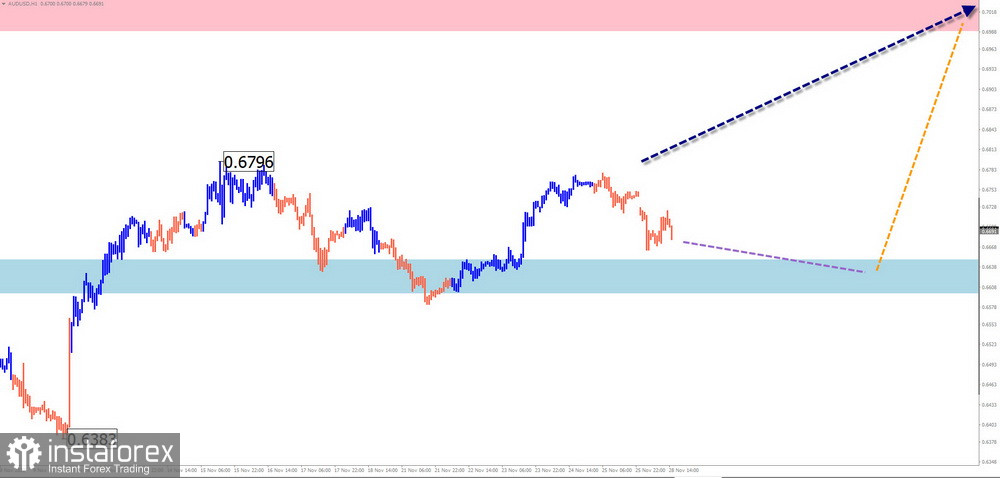
AUD/USD
Brief analysis
The Australian dollar chart's daily scale shows a downward trend. The bullish wave of October 13 and its subsequent growth could signal the start of a contrary short-term trend. The wave is undergoing an intermediate correction at the time of analysis. Its structure doesn't appear to be complete.
Forecast for the coming week:
The quotes for the pair are anticipated to move this week in a price corridor between the closest zones moving in the opposite direction. In the upcoming days, a downward vector is more likely. Only a decline as steep as the lower limit of support is anticipated. By the end of the week, price growth should start again.
Potential zones for reversals
Resistance:
- 0.6890/0.6940
Support:
- 0.6650/0.6600
Recommendations
Sales: A smaller lot may be used in separate sessions.
Purchases: Before verified reversal signals emerged in the support area, there were no prerequisites.
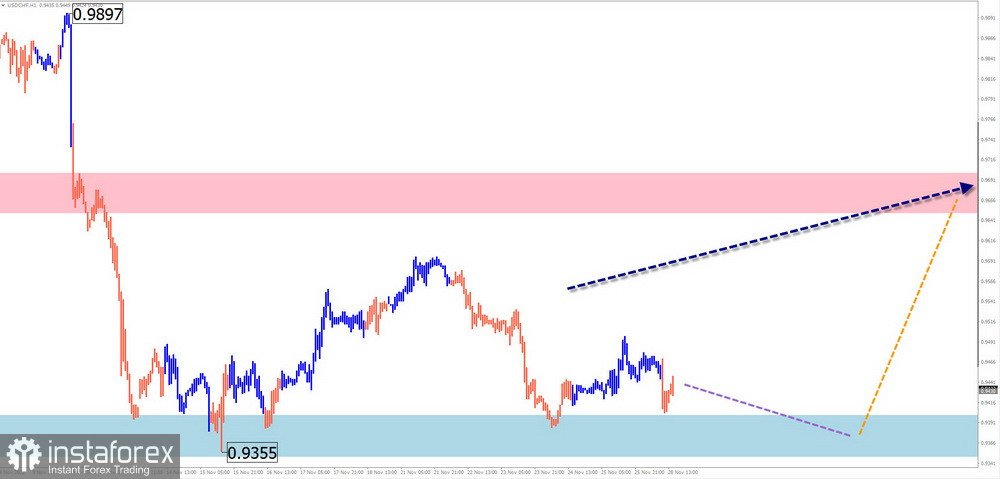
USD/CHF
Short analysis
Since mid-May, a complex corrective figure in the shape of a stretched plane has been forming on the chart of the main Swiss franc pair. It appears to be fully constructed. At the time of analysis, there is no chance that the ascending section from November 11 will reverse. The price has been forming this wave's middle part (B) for the past week.
Forecast for the coming week:
There is a good chance that the support zone will continue under pressure at the start of the week. Its lower border may experience a temporary puncture. The price then anticipates a direction change and a growth rate restart. The resistance zone displays the upper limit of the anticipated weekly course of the pair.
Potential zones for reversals
Resistance:
- 0.9650/0.9700
Support:
- 0.9400/0.9350
Recommendations
Sales: are very risky and can result in losses.
Purchases: they are advised for trading transactions once the corresponding signals appear in the support zone.
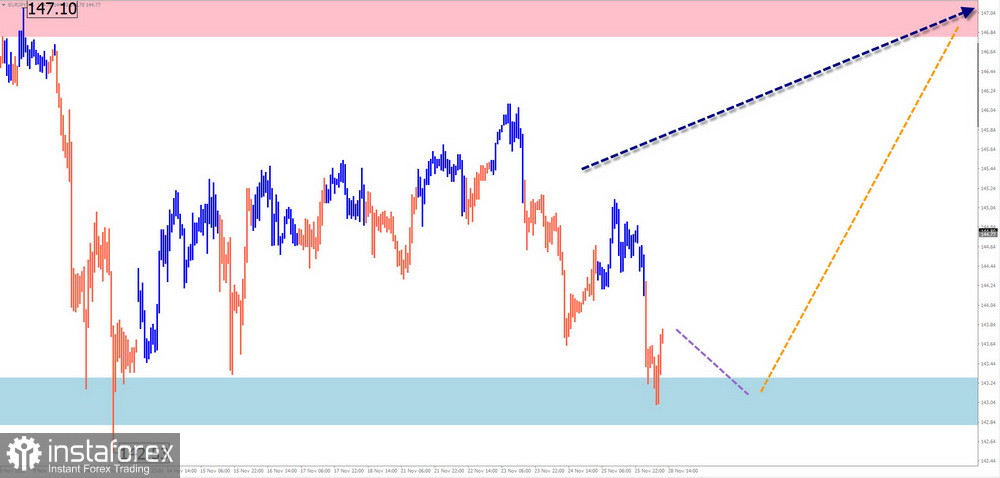
EUR/JPY
Brief analysis
The upward trend is still present on the weekly scale of the euro-yen cross chart. The price is getting close to the lower limit of the largest TF's potent potential reversal zone. Quotes have been lateralizing since October 17, creating a corrective structure. It resembles the "pennant" figure the most.
Forecast for the coming week:
On the pair's market, we can anticipate that the general lateral movement will continue in the upcoming sessions, primarily with a downward vector. The region surrounding the support zone is predicted to reverse. By the middle of the week, volatility will likely increase, and prices will be in an active growth phase.
Potential zones for reversals
Resistance:
- 146.80/147.30
Support:
- 143.30/142.80
Recommendations
Sales: within the intraday, sales are possible with a smaller lot, with a potential move to the support zone.
Purchases: Until your vehicle's corresponding signals appear in the support area, there will be no conditions for such transactions.
US dollar index
Brief analysis
Since September 26, the dollar index has been trending downward, and the structure of that wave indicates that a correction is necessary. The index quotes represent the first wave of a counter wave and the strong support since November 11. Its current potential is limited to the trend's final section's correction.
Forecast for the coming week:
In the upcoming days, the index quotes will keep moving along the support zone. Closer to the weekend, growth is likely to reverse and resume. The resistance zone demonstrates the instrument's maximum weekly movement.
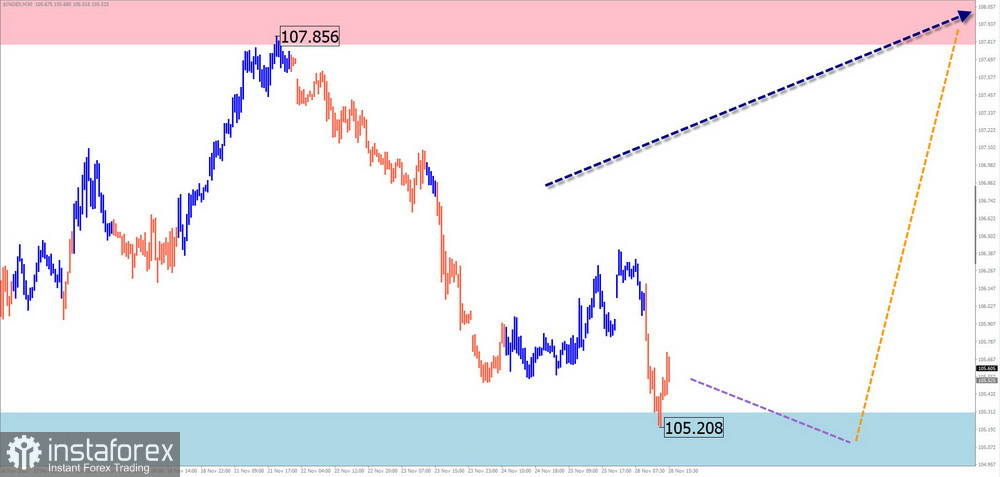
Potential zones for reversals
Resistance:
- 107.80/108.30
Support:
- 105.30/104.80
Recommendations
Purchases: Buying national currencies in the major pairs is not subject to any restrictions.
Sales will be advised in the majors once confirmed reversal signals appear in the support zone and the dollar increases.
Reasons: Each wave has three components in a simplified wave analysis (UVA). The final, incomplete wave is examined at each TF. The dotted line depicts the predicted movements.
Be aware that the wave algorithm does not account for how long the instruments' movements in time last!
InstaForex analytical reviews will make you fully aware of market trends! Being an InstaForex client, you are provided with a large number of free services for efficient trading.


