 Stay
Stay 
Trading Conditions
Products
Tools


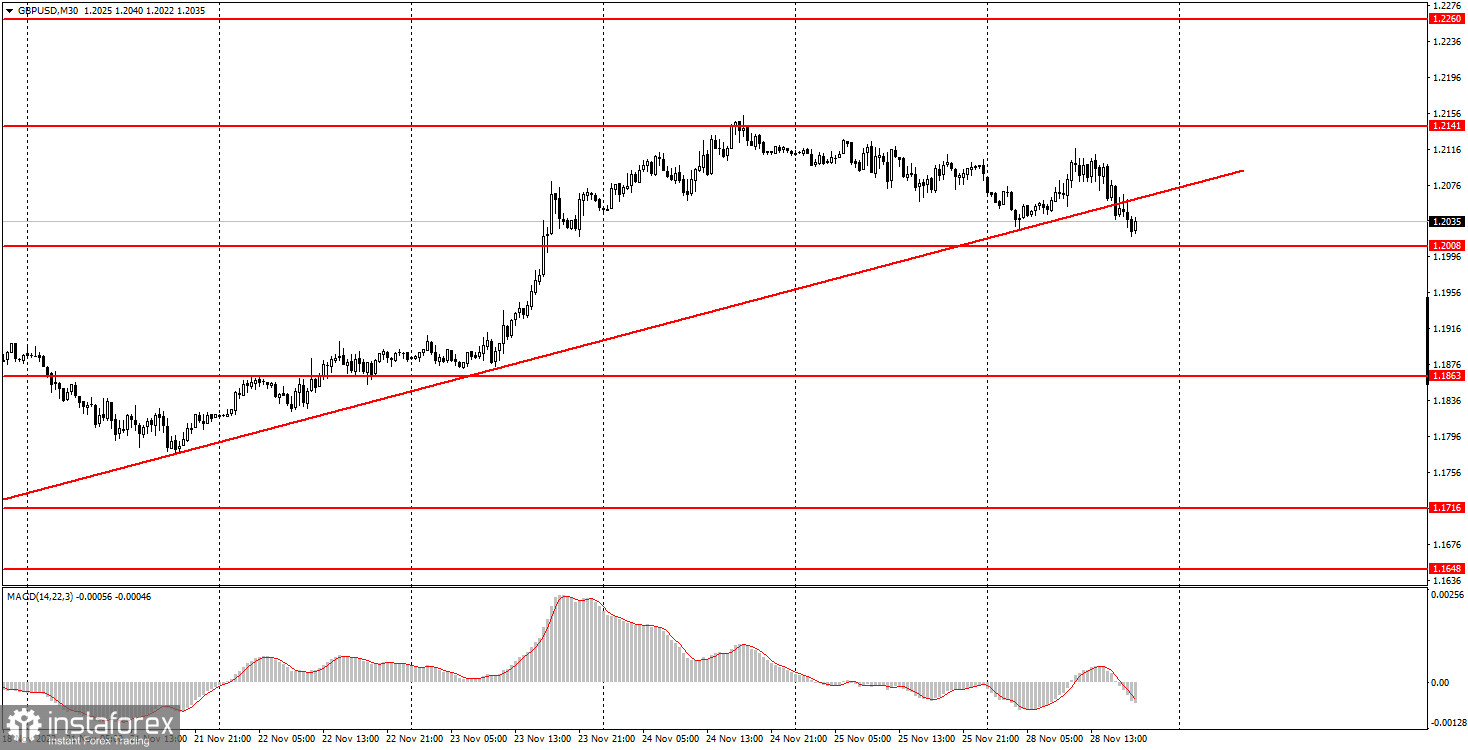
GBP/USD trade was discreet and had no distinct movements. Thus, the euro and the pound trade were absolutely different from each other, which is quite rare. The pound settled below the ascending trend line, which had been supporting the British currency for a long time. The currency has broken through this line. Look back on the fact that the euro had already crossed the trend line more than a week ago. Thus, for the first time in recent weeks there is a technical pattern in both pairs, which allows both currencies to fall. There was nothing interesting either in the UK or the USA on Monday. All the most important reports and events of the week are scheduled for the second half. The pound showed quite logical movement today, but it is rather difficult to say why the euro "flew" in different directions. Basically, we think that the downward correction has been brewing for a long time, so now there is a high probability that the currency could enter this phase.
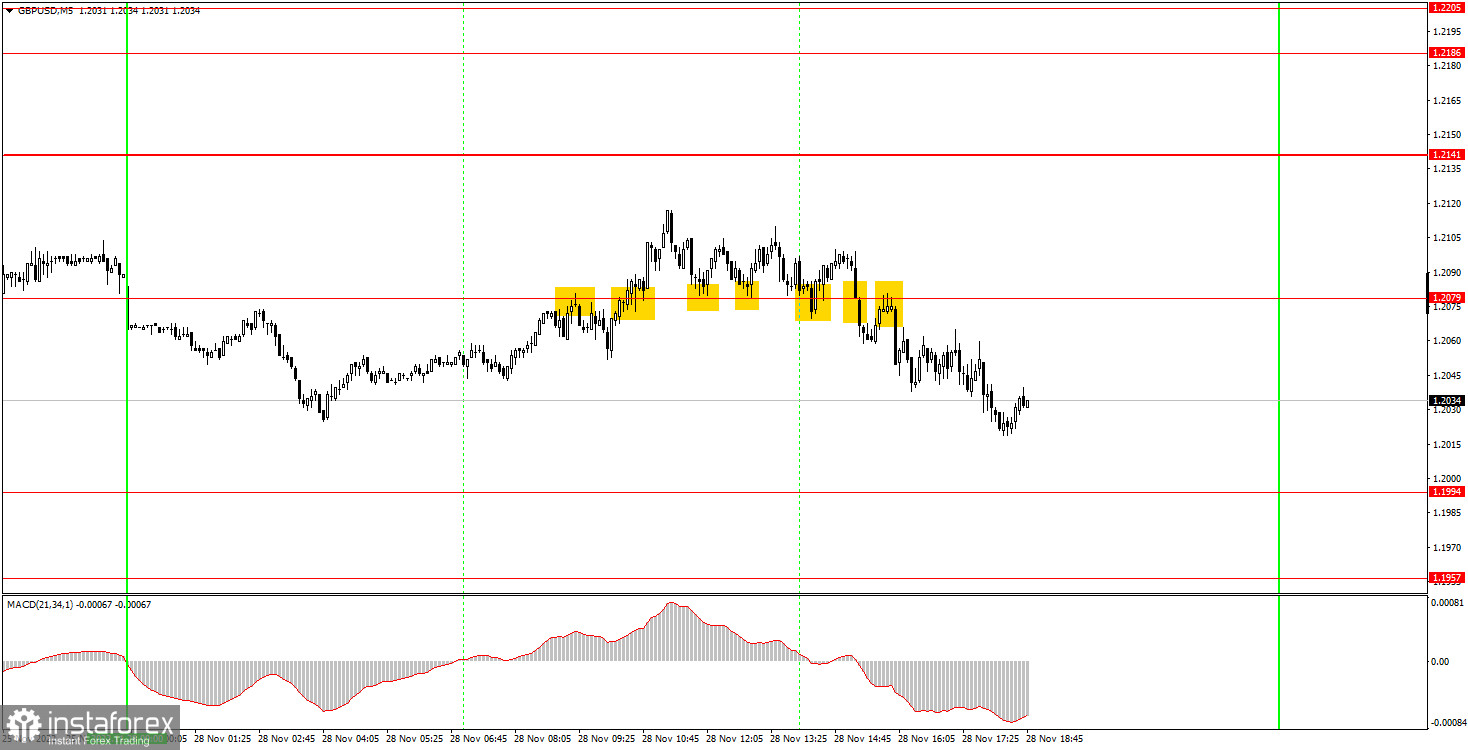
On the 5-minute chart, all the trading signals for the pound were unappealing compared to the ones for the euro. The movement was weaker and all the signals were near one level. This is considered a sign of a flat, but not in this case. Nevertheless, novice players could work out only the first two signals, because all except the last one turned out to be false. First, the pair rebounded from the level of 1.2079, then crossed it. In the first case, it passed in the right direction by 16 points, so even the Stop Loss could not be set to breakeven. In the second case, it passed almost 30 pips, so we have managed to place a Stop Loss. Consequently, there was a small loss on the first trade, but the profit on the euro has definitely covered it.
The pair has an opportunity to break the uptrend on the 30-minute time frame since the price has finally settled below the trend line. I already expected a sharp downtrend as early as last week, now both currency pairs can start it. On the 5-minute chart on Tuesday, it is recommended to trade at the levels 1.1793, 1.1863-1.1877, 1.1950-1.1957, 1.1994, 1.2079, 1.2141, 1.2186-1.2205, 1.2245-1.2260. As soon as the price passes 20 pips in the right direction, you should set a Stop Loss to breakeven. On Tuesday, there are no important events or reports in the UK or the US, so it will probably be a boring day for the pair. There will be nothing for traders to react to, but the pair could still increase volatility a bit.
1) The strength of the signal is determined by the time it took the signal to form (a rebound or a breakout of the level). The quicker it is formed, the stronger the signal is.
2) If two or more positions were opened near a certain level based on a false signal (which did not trigger a Take Profit or test the nearest target level), then all subsequent signals at this level should be ignored.
3) When trading flat, a pair can form multiple false signals or not form them at all. In any case, it is better to stop trading at the first sign of a flat movement.
4) Trades should be opened in the period between the start of the European session and the middle of the US trading hours when all positions must be closed manually.
5) You can trade using signals from the MACD indicator on the 30-minute time frame only amid strong volatility and a clear trend that should be confirmed by a trendline or a trend channel.
6) If two levels are located too close to each other (from 5 to 15 pips), they should be considered support and resistance levels.
Support and Resistance levels are the levels that serve as targets when buying or selling the pair. You can place Take Profit near these levels.
Red lines are channels or trend lines that display the current trend and show in which direction it is better to trade now.
The MACD indicator (14, 22, and 3) consists of a histogram and a signal line. When they cross, this is a signal to enter the market. It is recommended to use this indicator in combination with trend patterns (channels and trendlines).
Important announcements and economic reports that can be found on the economic calendar can seriously influence the trajectory of a currency pair. Therefore, at the time of their release, we recommend trading as carefully as possible or exiting the market in order to avoid sharp price fluctuations.
Beginners on Forex should remember that not every single trade has to be profitable. The development of a clear strategy and money management is the key to success in trading over a long period of time.
InstaForex analytical reviews will make you fully aware of market trends! Being an InstaForex client, you are provided with a large number of free services for efficient trading.

