 Stay
Stay 
Trading Conditions
Products
Tools


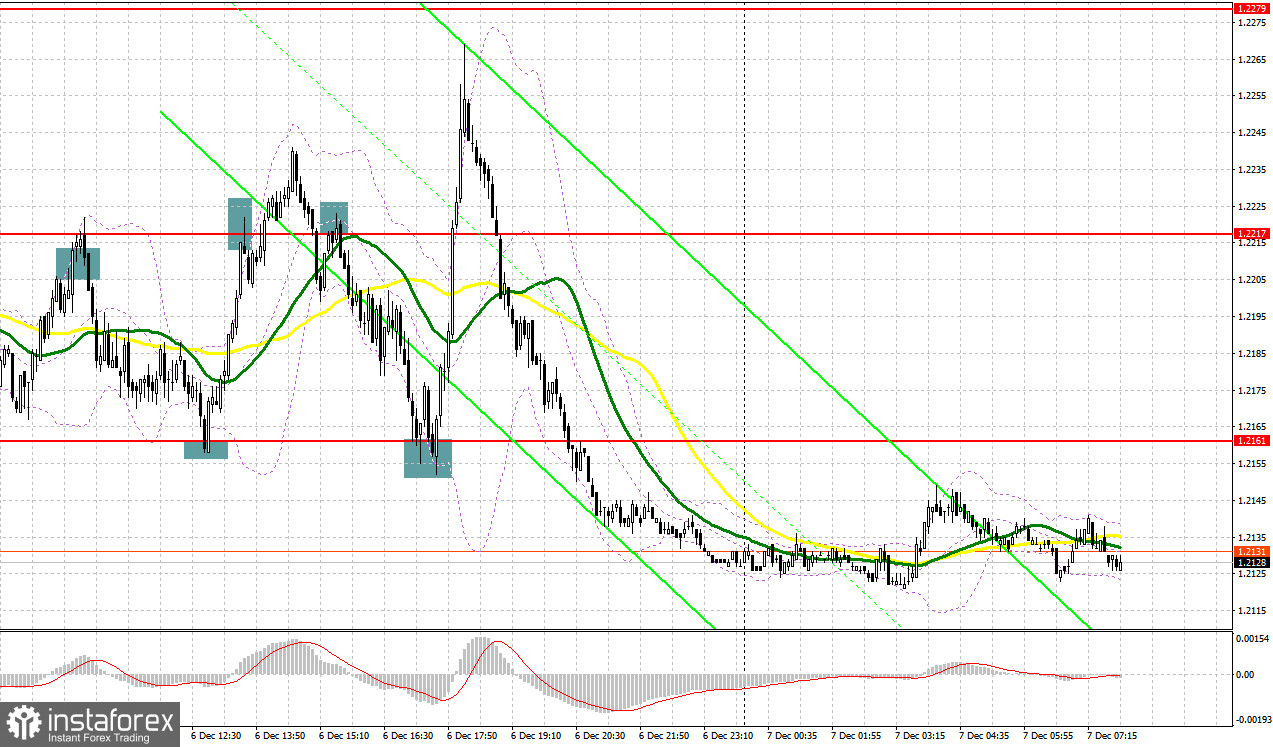
Yesterday, the pair formed a lot of good entry signals. Let's see what happened on the 5-minute chart. In my morning review, I mentioned the level of 1.2205 and recommended entering the market from there. A rise to 1.2205 and its false breakout allowed traders to add more short positions on the pair in line with the ongoing downtrend initiated yesterday. The pair went down by 40 pips but faced strong support at the level of 1.2161. After a false breakout of this level, a buy signal was formed. As a result, the pair reversed to the upside and retested 1.2217, generating more than 50 pips in profit. My first attempt to sell at 1.2217 failed so I had to close my position with losses. At the second attempt, a return to 1.2217 and its retest created another sell signal and triggered a fall toward 1.2161. In the middle of the New York session, bulls managed to fight back at 1.2161, thus creating more buying opportunities. After that, the pound advanced by more than 100 pips.
For long positions on GBP/USD:
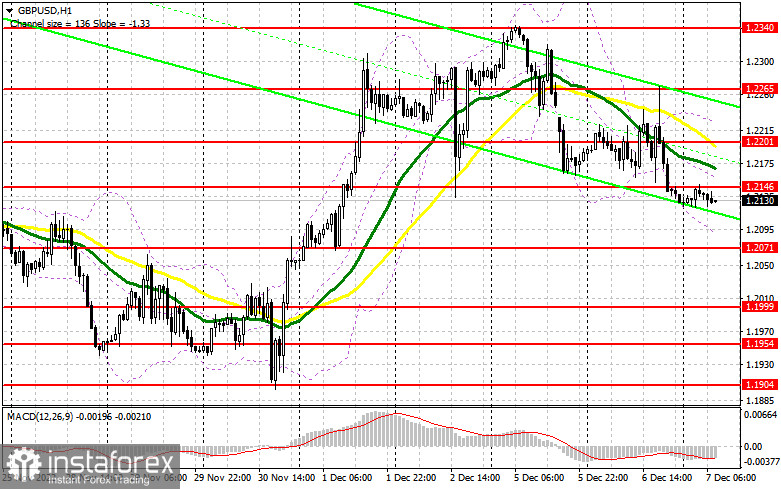
As the UK is facing strikes by healthcare and other workers, and authorities are struggling to tackle high inflation, the upside potential of the pound remains limited. The selling pressure is likely to persist today as well amid the lack of any important reports. However, the bulls may attempt to regain control. I bet on the further decline of the pair. Therefore, the best moment to go long will be a false breakout at 1.2071. It will give a good entry point into long positions and may return the pair to 1.2146. A breakout of this range and consolidation above it will be the main goal for the buyers today. Control over this level will allow the bulls to stabilize the situation and bring the pair to the sideways channel. A downward test of the 1.2146 level will strengthen the bulls and allow them to push the price higher to 1.2201 where moving averages limit the upside potential of the pair. A rise above this range will mean the recovery of the bullish trend. If so, the price may test the level of 1.2265. The area of 1.2340 will act as the most distant target where I recommend profit taking. If bulls fail to send the price to 1.2071, which is unlikely, I wouldn't recommend buying the pair. It would be reasonable to open long positions only after a decline and a false breakout at 1.1999. Buying GBP/USD immediately after a rebound should be done from 1.1954, considering an intraday correction of 30-35 pips.
For short positions on GBP/USD:
Bears have a chance to develop a downward correction in the first half of the day as there are no reasons for buying the pound at the current highs. In case of a strong decline, buyers will try to bring the price back. However, I doubt that traders will bet on the pair's uptrend at the end of the year and ahead of the meeting of the US Federal Reserve. The most that sellers can do in the morning is to protect the level of 1.2146. Its false breakout will give a good sell signal with a prospect of a further decline toward the support of 1.2071. At this point, trading activity is likely to increase as the correction against the bullish trend developed in November promises to be strong. A breakout of this range and its upward retest will create a good entry point for selling the pair, considering a reversal to 1.1999 where moving averages support the bulls. The level of 1.1954 will serve as the lowest target where I recommend profit taking. If GBP/USD rises and bears are idle at 1.2146, which is also possible, bulls will regain control of the market. In this case, only a false breakout at the next resistance of 1.2201 will give an entry point into short positions. If bears show no activity at this level, it is better to sell GBP/USD immediately after a rebound from the high of 1.2265, keeping in mind a possible downward correction of 30-35 pips within the day.
COT report
The Commitments of Traders (COT) report for November 29 showed a continued decrease in both short and long positions. Apparently, the recent macroeconomic data from the UK has dampened market optimism. A contraction in manufacturing and services activity indicates that the British economy is gradually sliding into a recession. The Bank of England prefers to ignore this fact as its top priority is to tame soaring inflation. According to the latest reports, inflation in the UK continues to accelerate. This is why It is hardly surprising that traders prefer to stay out of the market as they are not sure whether to buy or sell the pound. Given that the pair has strongly advanced since November this year, it is not advisable to open long positions at the current highs. Moreover, the US dollar is very likely to recover next week after the Fed's policy meeting and amid the strong performance of the US economy. The latest COT report revealed that long positions of the non-commercial group of traders decreased by 4,197 to 26,000 while short positions dropped by 4,275 to 62,584. This led to an increase in the negative value of the non-commercial net position to -36,584 versus -35,942 a week ago. The weekly closing price went up to 1.1958 from 1.1892.

Indicator signals:
Moving Averages
Trading below the 30- and 50-day moving averages indicates a continued decline in the pair.
Please note that the time period and levels of the moving averages are analyzed only for the H1 chart, which differs from the general definition of the classic daily moving averages on the D1 chart.
Bollinger Bands
In case of a decline, the lower band of the indicator at 1.2160 will serve as support.
Description of indicators:
• A moving average of a 50-day period determines the current trend by smoothing volatility and noise; marked in yellow on the chart;
• A moving average of a 30-day period determines the current trend by smoothing volatility and noise; marked in green on the chart;
• MACD Indicator (Moving Average Convergence/Divergence) Fast EMA with a 12-day period; Slow EMA with a 26-day period. SMA with a 9-day period;
• Bollinger Bands: 20-day period;
• Non-commercial traders are speculators such as individual traders, hedge funds, and large institutions who use the futures market for speculative purposes and meet certain requirements;
• Long non-commercial positions represent the total number of long positions opened by non-commercial traders;
• Short non-commercial positions represent the total number of short positions opened by non-commercial traders;
• The non-commercial net position is the difference between short and long positions of non-commercial traders.
InstaForex analytical reviews will make you fully aware of market trends! Being an InstaForex client, you are provided with a large number of free services for efficient trading.

