 Maradok
Kereskedési feltételek
Products
Eszkozok

The pair is consolidating the price action above the 200 SMA at the H1 chart and it's heading towards the resistance zone of 1.4166. If a breakout happens over there, then we might expect a bullish continuation to test the 1.4225 level, as the sellers could appear in order to make a corrective move. MACD indicator remains in the positive territory, favoring to the bulls in the short-term.
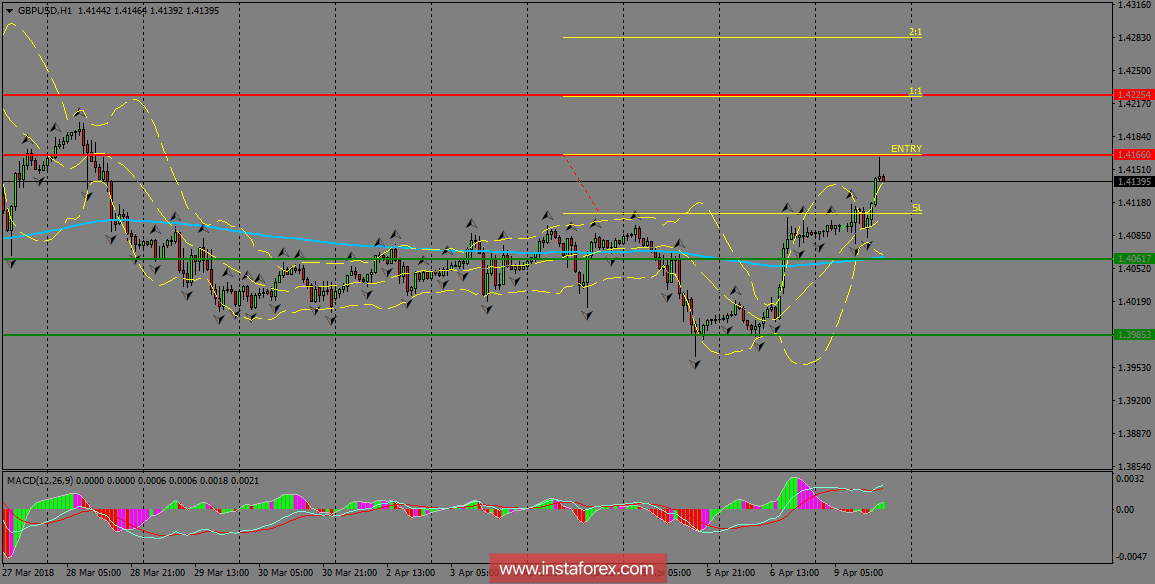
H1 chart's resistance levels: 1.4166 / 1.4225
H1 chart's support levels: 1.4061 / 1.3985
Trading recommendations for today: Based on the H1 chart, buy (long) orders only if the GBP/USD pair breaks a bullish candlestick; the resistance level is at 1.4166, take profit is at 1.4225 and stop loss is at 1.4108.InstaForex analytical reviews will make you fully aware of market trends! Being an InstaForex client, you are provided with a large number of free services for efficient trading.


