 Maradok
Kereskedési feltételek
Products
Eszkozok


EUR/USD. The basic trend is a little bullish and the short term is tentatively bearish. With such a pattern, the price could just as easily move towards the first support as the first resistance (1.2138).
The first support is located at 1.2090. The first resistance is located at 1.2203. With no basic trend, it will be important to monitor the reaction of the price to the levels cited.
A bullish break in the resistance could quickly reverse the basic trend. A bullish break in resistance would be welcome to boost the slightly bullish basic trend.
Amid the previous events, the price is still moving between the levels of 1.2090 and 1.2203. Also, the daily resistance and support are seen at the levels of 1.2090 and 1.2203 respectively.
Therefore, it is recommended to be cautious while placing orders in this area. So, we need to wait until the downtrend channel has completed.
On the other hand, if the price is blocked by support or resistance, it could be attractive to trade against the trend on the last short-term movement registered by the GBP/USD pair.
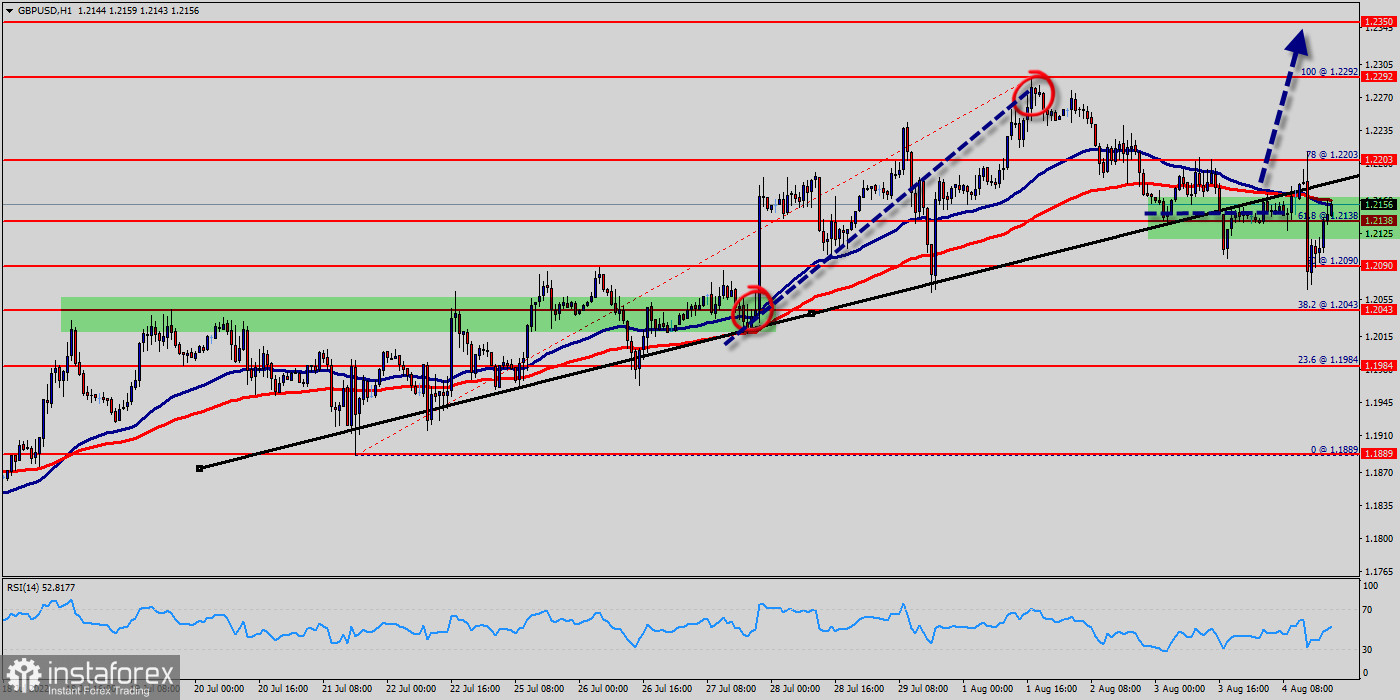
Yesterday, the market moved from its bottom at 1.2090 and continued to rise towards the top of 1.2203.
The trend rebounded from the top point of 1.2203 to set at 1.2156.
Today, in the one-hour chart, the current rise will remain within a framework of correction.
However, if the pair fails to pass through the level of 1.2090 (support), the market will indicate a bullish opportunity above the strong support level of 1.2090 (the level of 1.2090 coincides with the ratio of 50% Fibonacci).
Since there is nothing new in this market, it is not bearish yet. Currently, the price is in a bullish channel.
Since the trend is above the 50% Fibonacci level, the market is still in an uptrend. From this point, the GBP/USD pair is continuing in a bullish trend from the new support of 1.2090.
Accordingly, the GBP/USD pair is showing signs of strength following a breakout of the highest level of 1.2138.
So, buy above the level of 1.2138 with the first target at 1.2203 in order to test the daily resistance 1 and further to 1.2292.
Also, it might be noted that the level of 1.2292 is a good place to take profit because it will form a double top.
On the other hand, in case a reversal takes place and the GBP/USD pair breaks through the support level of 1.2090, a further decline to 1.1984 can occur which would indicate a bearish market.
InstaForex analytical reviews will make you fully aware of market trends! Being an InstaForex client, you are provided with a large number of free services for efficient trading.


