 Maradok
Kereskedési feltételek
Products
Eszkozok


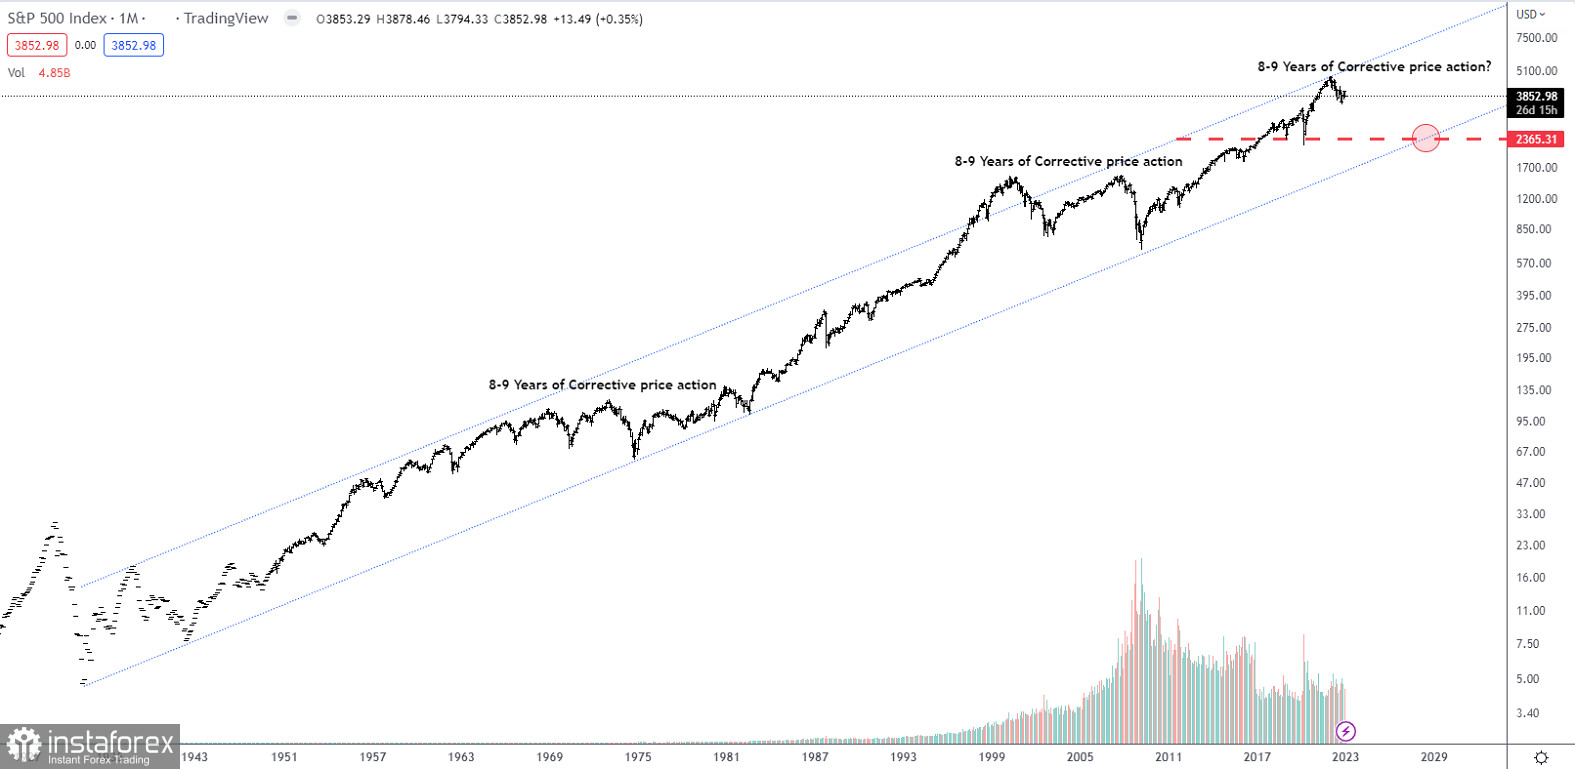
As we are at the beginning of the year, let's try to get a feel for the possible price action for 2023. The S&P 500 index hit the top of the rising price channel at the beginning of 2022 indicating possible exhaustion of the impulsive rally from March 2009. Looking back in time, we can see three major corrections unfolding. The first after the 1937 peak was a decline lasting 5 years to 1942, but it was a very deep correction, correcting 78.6% of the rally from 1932 to 1937. The second correction lasted from 1966 to 1974, a very shallow correction, that only corrected 38.2% of the impulsive rally from 1937 to 1966. Finally, the third impulsive rally running from 1974 to 2000 was corrected from the 2000 peak to the 2009 bottom which is an almost 61.8% correction of the 1974 - 2000 rally. The last two corrections both took 8-9 years to complete. If this is the case too this time, then we can expect a bottom around 2029 - 2030 and close to support near 2,365.
Let's be clear, that a correction unfolding through to 2029 doesn't mean we can't see a new all-time high during the period, but it's no guarantee. Yes, we did see a new all-time high during the 1966-1974 correction and we also did see a new all-time high during the 2000-2009 correction, but we didn't see one during the 1937 - 1942 correction, but this correction was also shorter in duration.
Therefore, our conclusion is that a deep correction will be shorter in duration, but not in price points, while a more shallow sideways correction will take up more time and fewer price points. All in all, we are looking into some tough years ahead as we correct the excessive liquidity creation of central banks and governments in the last 13 years and especially in the last two years due to the coronavirus pandemic.
InstaForex analytical reviews will make you fully aware of market trends! Being an InstaForex client, you are provided with a large number of free services for efficient trading.


