 Maradok
Kereskedési feltételek
Products
Eszkozok


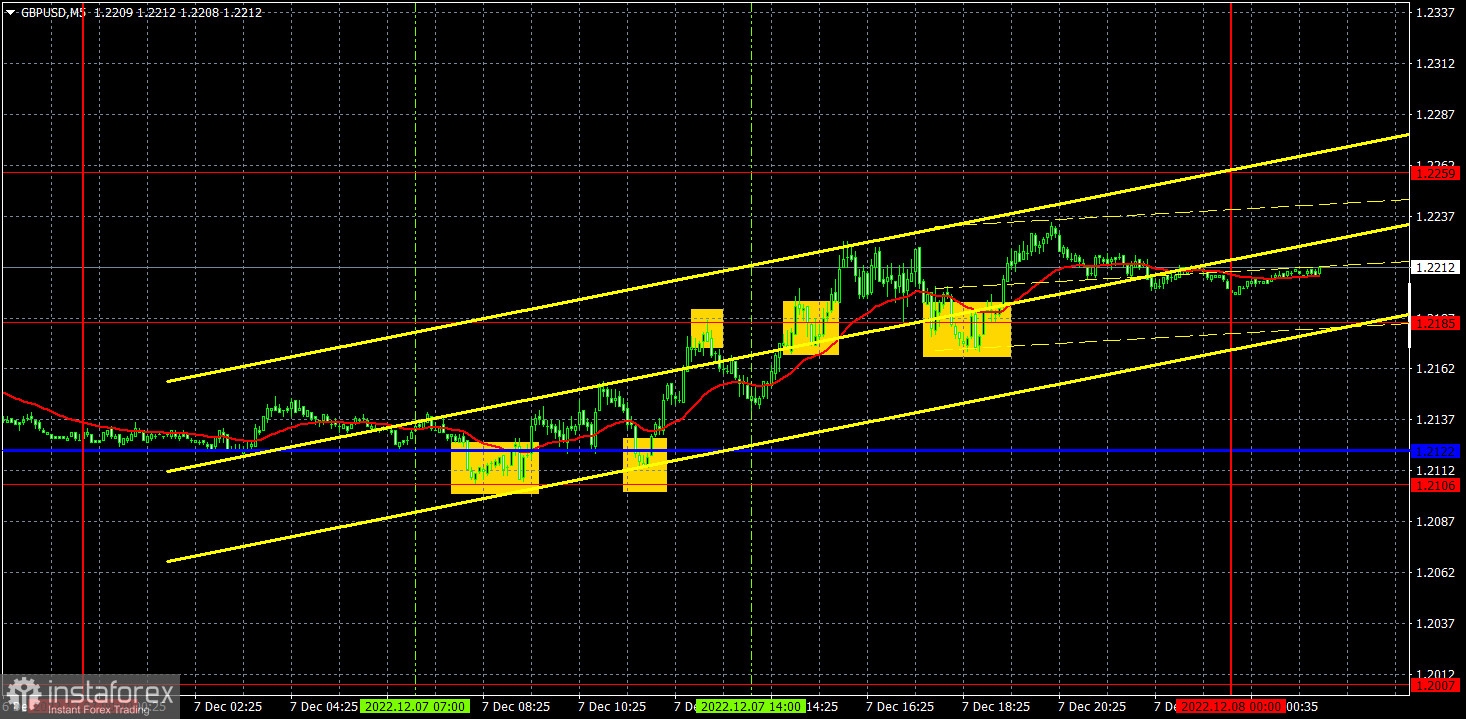
On Thursday, GBP/USD traded higher but failed to break through the critical line. Therefore, a downtrend may resume with the target at the Senkou Span B. The pair's volatility has decreased this week. Its movements have been chaotic, which made it quite difficult to trade, with signals being either weak or false. Traders have started to ignore the lines of the Ichimoku indicator, which may indicate an impending flat. On Thursday, there was not a single report or event, able to influence the market.
A lot of trading signals were generated yesterday but they were mostly false. In the M5 time frame, the first three signals were made near the extreme level of 1.2185. The first two signals turned out to be false. Consequently, there was no point in opening a position after the third signal. Further, several signals were produced near the critical line. Still, they were also partially false. All in all, yesterday's trading brought insignificant losses.
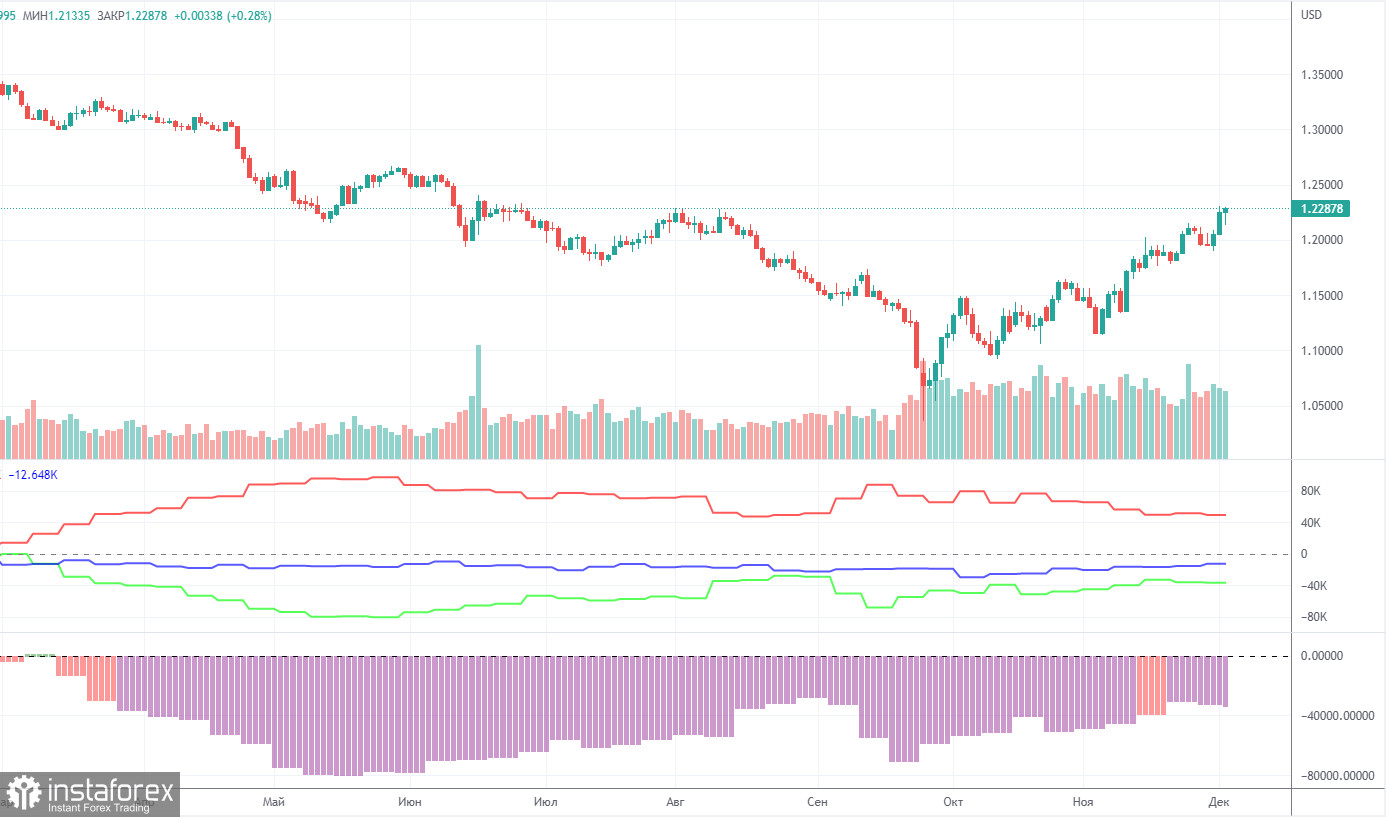
The latest COT report showed an increase in bearish sentiment for the second straight week. During the reporting week, non-commercial traders closed 5,000 long positions and 4,000 short ones. The net position dropped by 1,000. The figure has been on the rise for several months. Nevertheless, sentiment remains bearish, and the pound is on the rise against the greenback for no reason. We assume that the pair may well resume the downtrend soon. Notably, both GBP/USD and EUR/USD now show practically identical movement. At the same time, the net position on EUR/USD is positive and negative on GBP/USD. Non-commercial traders now hold 62,000 sell positions and 28,500 long ones. The gap between them is quite wide. As for the total number of open longs and shorts, the bulls have an advantage here by 13,000. Technical factors indicate that the pound may move in an uptrend in the long term. At the same time, fundamental and geopolitical factors signal that the currency is unlikely to strengthen significantly.
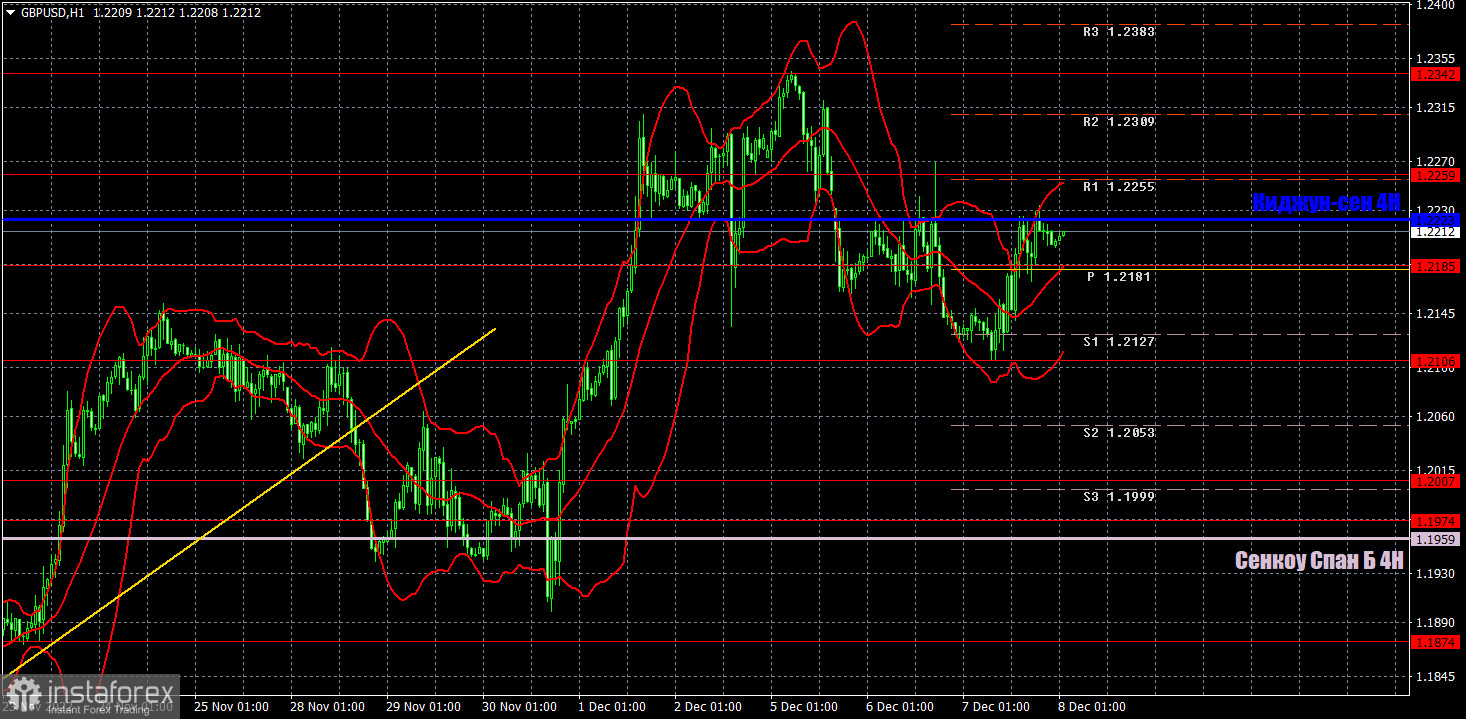
In the H1 time frame, GBP/USD keeps trading noticeably higher. It remains to be seen whether the pair settles above the critical line. If it does, the uptrend may resume. Otherwise, the price may fall to the Senkou Span B. This week, the pair may also be flat, as the H4 time frame shows. On Friday, trading levels are seen at 1.1760, 1.1874, 1.1974-1.2007, 1.2106, 1.2185, 1.2259, 1.2342, 1.2429-1.2458 as well as 1.2041 (Senkou Span B) and 1.222 (Kijun-sen). Signals are made whenever the price bounces or breaks through these levels and lines. Don't forget to place a stop-loss order at the breakeven point when the price passes 20 pips in the right direction. Ichimoku indicator lines can move during the day, which should be taken into account when determining trading signals. There are also support and resistance that can be used for profit-taking. On Monday, the macroeconomic calendar contains no important releases in the UK. The US will see the release of the Michigan consumer sentiment index, which will be published by the end of the day when it is already time to think about closing trades and leaving the market.
Resistance/support - thick red lines, near which the trend may stop. They do not make trading signals.
The Kijun-sen and Senkou Span B lines are the Ichimoku indicator lines moved to the hourly timeframe from the 4-hour timeframe. They are also strong lines.
Extreme levels are thin red lines, from which the price used to bounce earlier. They can produce trading signals.
Yellow lines are trend lines, trend channels, and any other technical patterns.
Indicator 1 on the COT chart is the size of the net position of each trader category.
Indicator 2 on the COT chart is the size of the net position for the Non-commercial group of traders.
InstaForex analytical reviews will make you fully aware of market trends! Being an InstaForex client, you are provided with a large number of free services for efficient trading.


