 Maradok
Kereskedési feltételek
Products
Eszkozok


Trend analysis
GBP/USD may start moving upward this week, starting from the level of 1.2344 (closing of the last weekly candle) to 1.2499, which is a historical resistance level (blue dashed line). Upon reaching this price, the pair will climb further to 1.2678, which is an upper fractal (red dashed line).
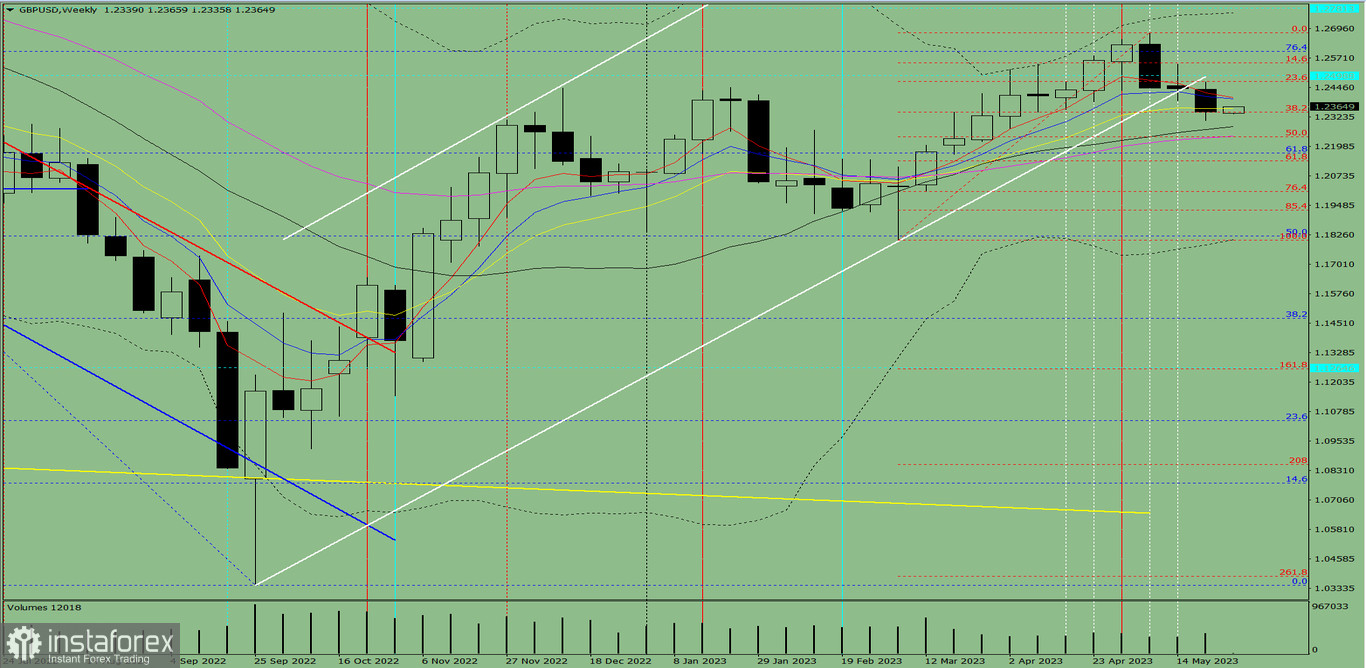
Fig. 1 (weekly chart)
Comprehensive analysis:
Indicator analysis - upward
Fibonacci levels - upward
Volumes - upward
Candlestick analysis - upward
Trend analysis - downward
Bollinger bands - upward
Monthly chart - upward
All these point to an upward movement in GBP/USD.
Conclusion: Most likely, the pair will have a bullish trend, with no first lower shadow on the weekly white candle (Monday - upward) and a second upper shadow (Friday - downward).
So during the week, pound will rise from 1.2344 (closing of the last weekly candle) to the historical resistance level at 1.2499 (blue dashed line), and then head to the upper fractal at 1.2678 (red dashed line).
Alternatively, the quote could go up from 1.2344 (closing of last week's candle) to the historical resistance level at 1.2499 (blue dashed line), and then turn around and fall down to the 38.2% retracement level at 1.2342 (red dashed line).
InstaForex analytical reviews will make you fully aware of market trends! Being an InstaForex client, you are provided with a large number of free services for efficient trading.


