 Maradok
Kereskedési feltételek
Products
Eszkozok


Trend analysis (Fig. 1).
The EUR/USD currency pair may move downward from the level of 1.0660 (closing of yesterday's daily candle) to the lower fractal at 1.0635 (red dotted line). In the case of testing this level, an upward movement is possible with a target of 1.0707, the historical resistance level (blue dotted line).
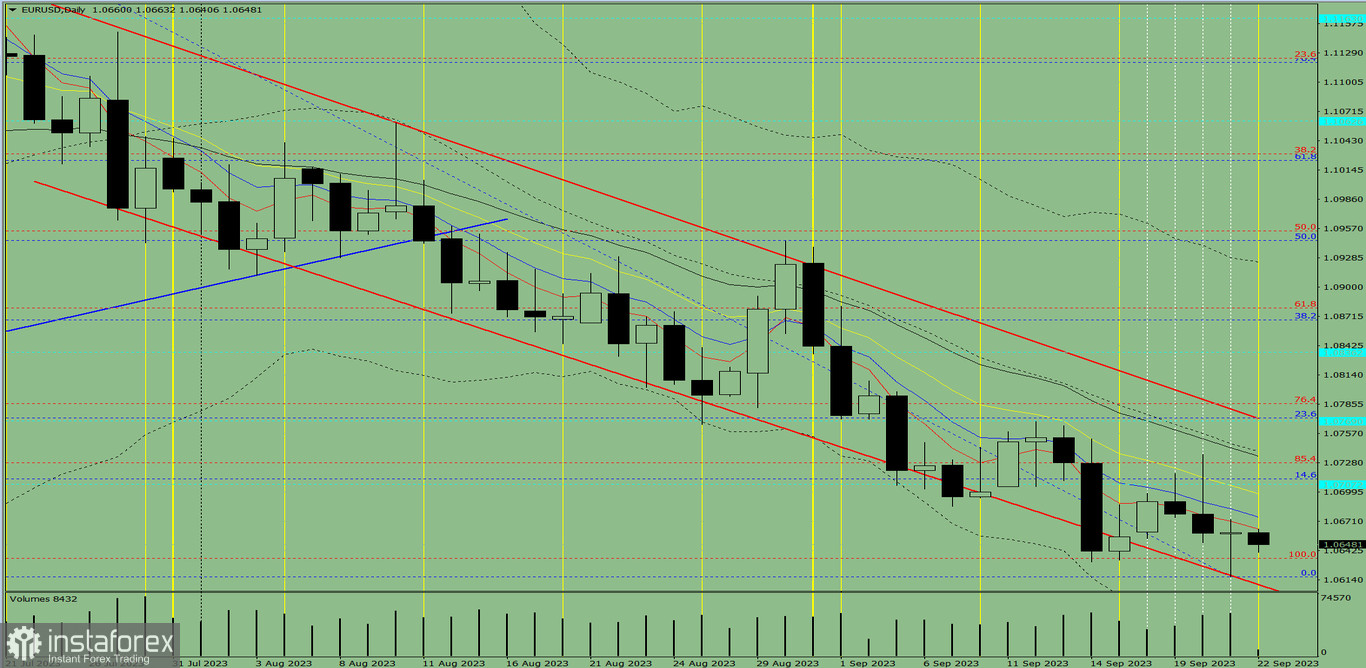
Fig. 1 (daily chart).
Comprehensive analysis:
General conclusion: Today, the price may move downward from the level of 1.0660 (closing of yesterday's daily candle) to the lower fractal at 1.0635 (red dotted line). In the case of testing this level, an upward movement is possible with a target of 1.0707, the historical resistance level (blue dotted line).
Alternatively, the price may move downward from the level of 1.0660 (closing of yesterday's daily candle) to the lower fractal at 1.0617 (blue dotted line). In the case of testing this level, an upward movement is possible with a target of 1.0707, the historical resistance level (blue dotted line).
InstaForex analytical reviews will make you fully aware of market trends! Being an InstaForex client, you are provided with a large number of free services for efficient trading.


