 Maradok
Kereskedési feltételek
Products
Eszkozok


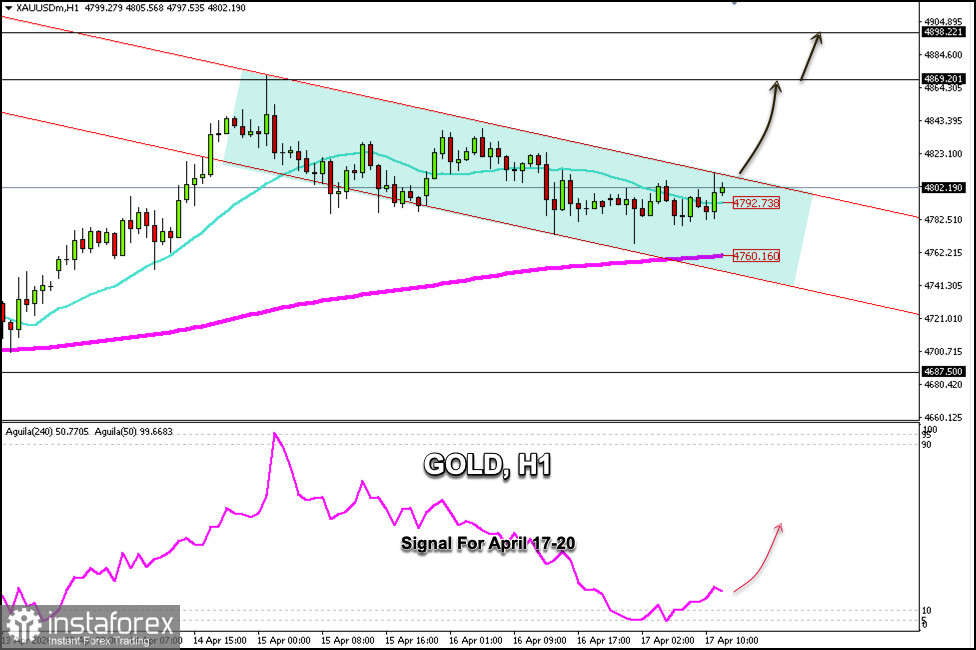
Gold is trading around $4,802 within a bearish trend channel on the H1 chart that has been forming since April 14. The chart shows that gold is consolidating above the 200-period EMA at $4,760, suggesting that gold could see a recovery in the coming days, potentially reaching the R_3 resistance level at $4,898.
Looking at the H1 chart, gold is above the 21SMA and is testing the strong resistance of the downtrend channel. Technically, XAU/USD appears to be forming a bullish pennant pattern on the H4 chart. If the price consolidates above $4,800, we could expect it to reach $4,869 and $4,900 in the coming hours.
Conversely, if gold fails to break above $4,800, we could expect a correction toward the 200 EMA at $4,760, and we could anticipate a technical bounce in this area.
The Eagle indicator is showing a positive signal, hence gold is likely to continue rising in the coming hours. Therefore, we will use this technical analysis to buy above the 21 SMA at $4,792 or above $4,760, as both levels offer a positive outlook for gold in the coming hours.
InstaForex analytical reviews will make you fully aware of market trends! Being an InstaForex client, you are provided with a large number of free services for efficient trading.


