 Maradok
Kereskedési feltételek
Products
Eszkozok


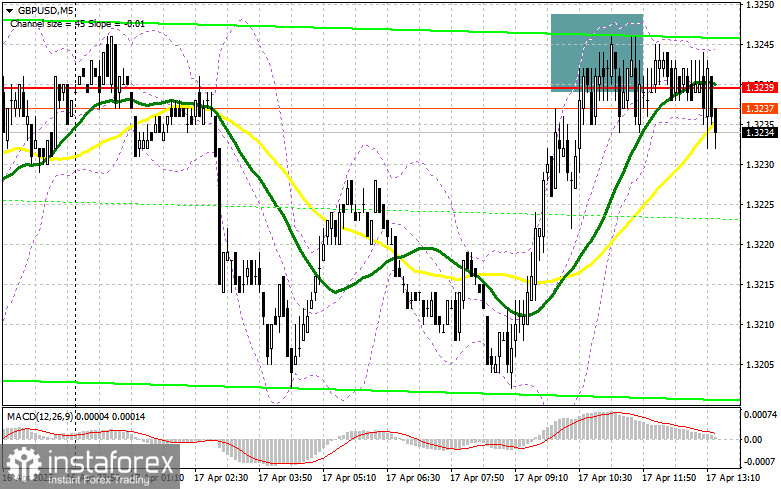
In my morning forecast, I focused on the 1.3239 level and planned to base entry decisions around it. Let's look at the 5-minute chart and see what happened. A rise and a false breakout formed around that level, creating an entry point for selling the pound. However, as you can see on the chart, the pair didn't experience a significant decline. The technical picture has since been revised for the second half of the day.
To open long positions on GBP/USD:
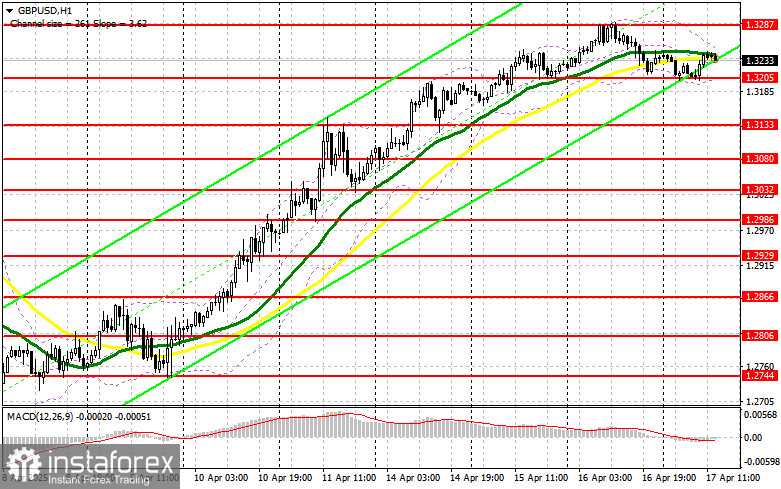
The lack of news from the UK has affected the pound's volatility, so further movement will depend entirely on U.S. data and traders' reaction to the ECB's decision. Strong figures on initial jobless claims, building permits, and housing starts in the U.S. would be enough to bring pressure back to GBP/USD. In this case, I'll act on a correction, entering long positions after a false breakout near the new support at 1.3205, which was established earlier today. This will provide a good entry point targeting a recovery toward resistance at 1.3287. A breakout with a retest from above will provide another entry point to continue the bullish market toward 1.3337. The furthest target will be the 1.3380 area, where I will take profit.
If GBP/USD falls and bulls show no activity near 1.3205, pressure on the pair will increase. In that case, only a false breakout near 1.3133 would provide a good entry signal for long positions. I plan to buy GBP/USD on a rebound from 1.3080 for a 30–35 point intraday correction.
To open short positions on GBP/USD:
Sellers are still showing little activity. If GBP/USD rises during the U.S. session following U.S. data or FOMC member Michael S. Barr's dovish speech, a false breakout near 1.3287 will offer a short entry point, targeting a drop to support at 1.3205, where the moving averages are currently supporting the bulls. A breakout and retest from below this range would likely trigger stop orders and open the way toward 1.3133. The final target will be 1.3080, where I plan to take profit.
If demand for the pound persists in the second half of the day—which is more likely—and bears do not appear at 1.3287, it would be better to delay shorts until a test of the 1.3337 resistance. I will sell there only after a failed breakout. If no downward movement follows there either, I'll look to short on a rebound from 1.3380, aiming for a 30–35 point correction.
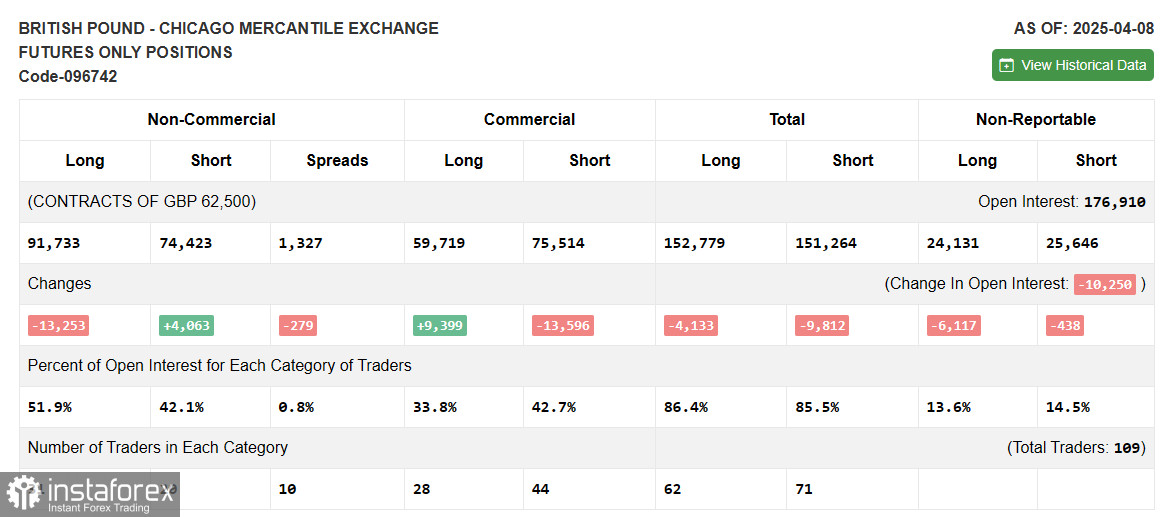
COT Report (Commitment of Traders) – April 8:
The report showed a slight increase in short positions and a reduction in long ones. It's important to note that this report includes Trump's decision to pause tariffs for 90 days but doesn't reflect the recent strong UK GDP growth data. Nevertheless, demand for the pound remains strong, as seen in the overall advantage of buyers over sellers.
Long non-commercial positions fell by 13,253 to 91,733 and short non-commercial positions rose by 4,063 to 74,423. As a result, the gap between long and short positions narrowed by 279.
Indicator Signals:
Moving Averages: Trading is taking place near the 30- and 50-day moving averages, indicating a sideways market.
Note: The periods and prices of moving averages are based on the author's H1 (hourly) chart and differ from classic D1 (daily) averages.
Bollinger Bands: If the pair declines, the lower boundary of the indicator around 1.3205 will serve as support.
Indicator Descriptions:
InstaForex analytical reviews will make you fully aware of market trends! Being an InstaForex client, you are provided with a large number of free services for efficient trading.


