 Maradok
Kereskedési feltételek
Products
Eszkozok


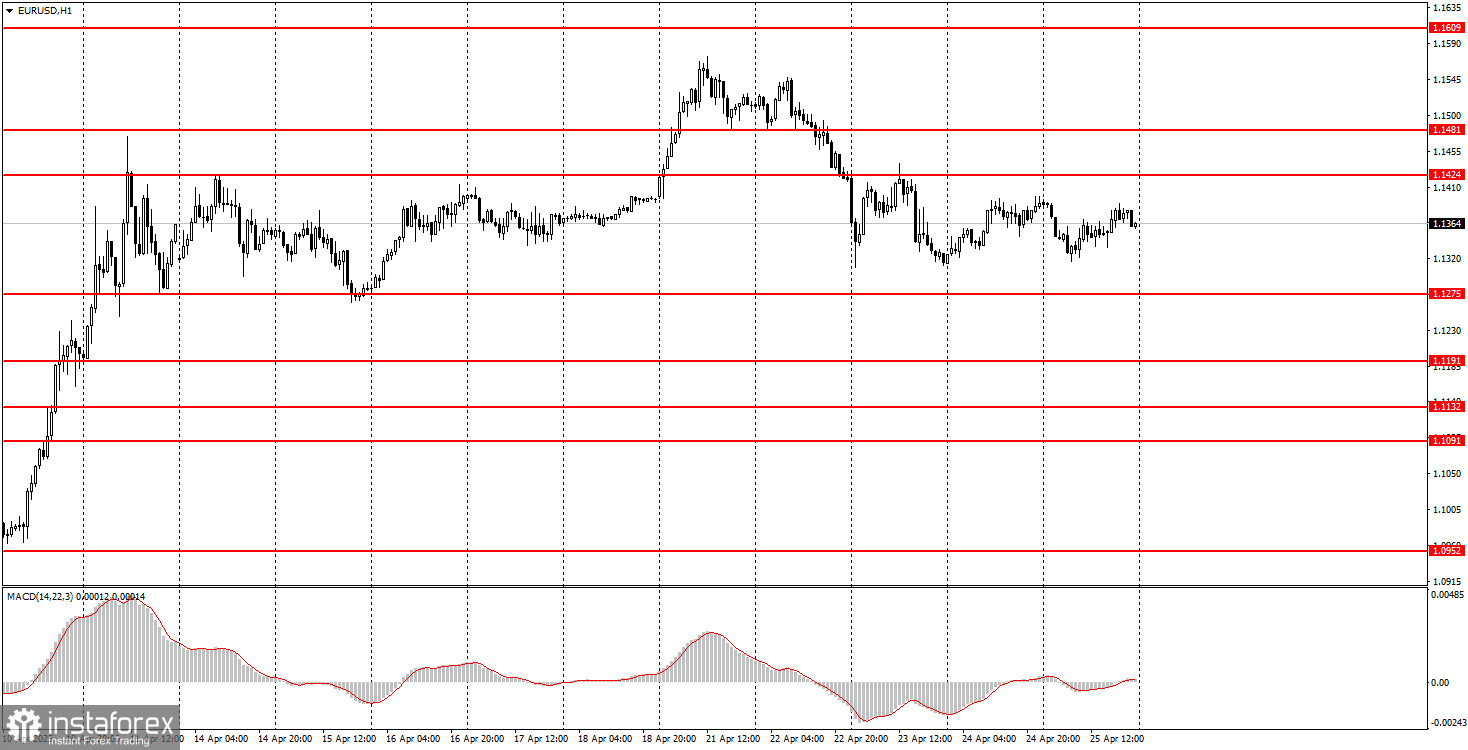
The EUR/USD currency pair continued to trade sideways on Friday. The market continues to ignore all macroeconomic data, and last week once again confirmed this obvious fact. Even without considering secondary reports, we observed movements in the market only on Monday and Tuesday. Naturally, in both cases, these movements were triggered by Donald Trump. However, this time, they were not related to trade issues but to Jerome Powell. First, Trump stated that Powell should be fired, and the market immediately rushed to sell the US dollar. Then Trump said he was no longer planning to fire Powell, and the dollar returned to its previous positions. Excluding these moves, the pair continues its sideways movement without news about the global trade war. The sideways channel is easy to identify, ranging from 1.1275 to 1.1424.
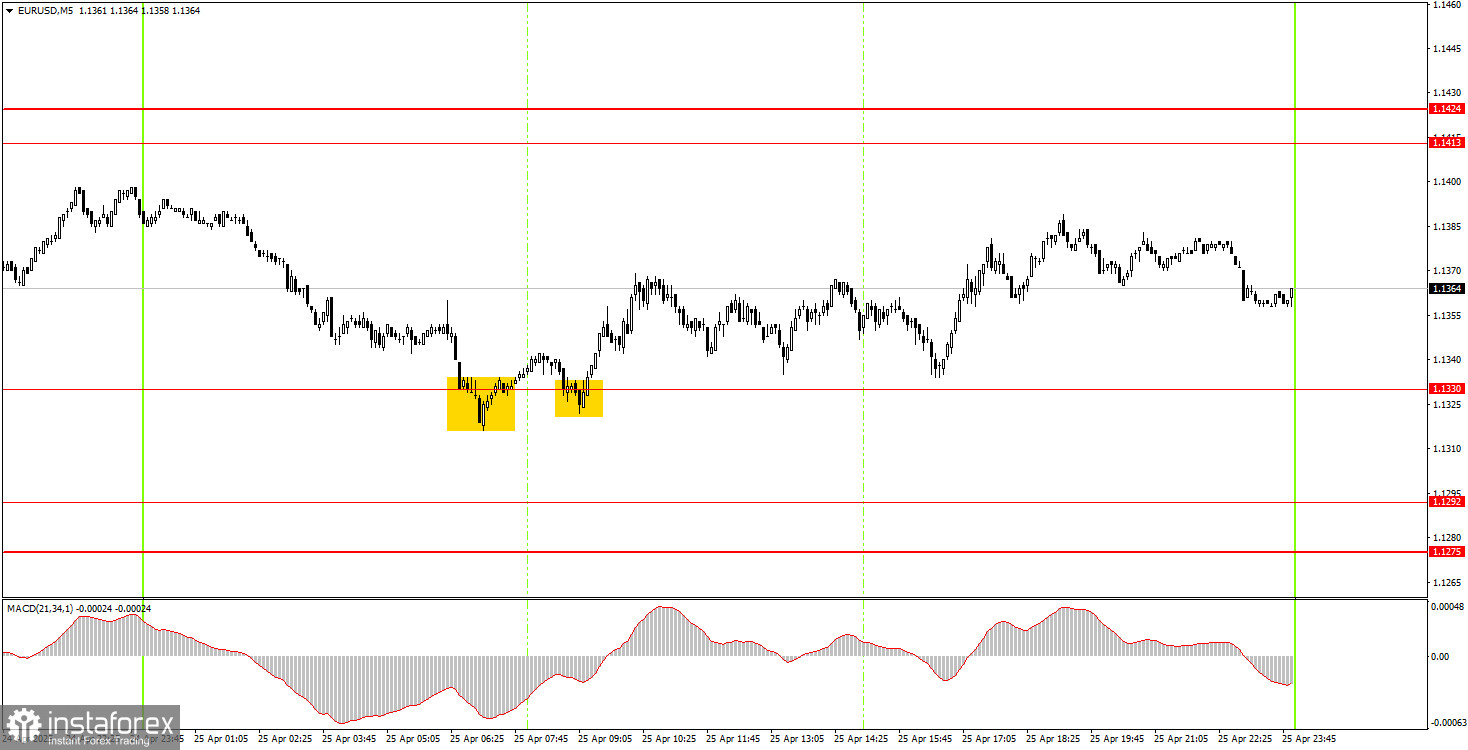
In the 5-minute timeframe, the movements are not particularly appealing. The price moves at the speed of light or trades in a clear flat. It remained in a clear flat on Wednesday, Thursday, and Friday, and even macroeconomic data could not stir it. Nevertheless, on Friday, the price rebounded twice from the 1.1330 level, although neither rebound was precise. Thus, novice traders could have opened long positions on each bounce, but the overall volatility during the European and American sessions was only 67 pips, and the target level of 1.1413 was not reached even once.
The EUR/USD pair maintains an upward trend in the hourly timeframe. Last week started with a new rally, but by Tuesday, Trump had already provoked a decline. If we disregard these movements, the market has actually been flat for two weeks. Overall, the market remains extremely negative toward the U.S. dollar and everything American. However, if Trump shifts toward de-escalating the trade conflict he initiated, the dollar could improve its position soon.
On Monday, the pair could once again move in either direction, as all market movements still depend on Trump's statements and decisions. If Trump does not deliver any major news over the weekend, the flat movement could continue on Monday.
On the 5-minute timeframe, the following levels should be considered: 1.0940–1.0952, 1.1011, 1.1091, 1.1132–1.1140, 1.1189–1.1191, 1.1275–1.1292, 1.1330, 1.1413–1.1424, 1.1474–1.1481, 1.1513, 1.1548, 1.1571, 1.1607–1.1622, 1.1666, 1.1689. On Monday, no major reports or events are scheduled in the Eurozone or the United States. However, it is important to continue monitoring Trump's speeches.
Support and Resistance Levels: These are target levels for opening or closing positions and can also serve as points for placing Take Profit orders.
Red Lines: Channels or trendlines indicating the current trend and the preferred direction for trading.
MACD Indicator (14,22,3): A histogram and signal line used as a supplementary source of trading signals.
Important Events and Reports: Found in the economic calendar, these can heavily influence price movements. Exercise caution or exit the market during their release to avoid sharp reversals.
Forex trading beginners should remember that not every trade will be profitable. Developing a clear strategy and practicing proper money management are essential for long-term trading success.
InstaForex analytical reviews will make you fully aware of market trends! Being an InstaForex client, you are provided with a large number of free services for efficient trading.


