 Maradok
Kereskedési feltételek
Products
Eszkozok


To Open Long Positions on EUR/USD:
Given the brief pause in the Israel–Iran conflict, the euro has slightly recovered, but further growth remains limited. In the second half of the day, we expect the University of Michigan Consumer Sentiment Index and inflation expectations data. The market's reaction to these figures will likely be muted, especially given the geopolitical backdrop.
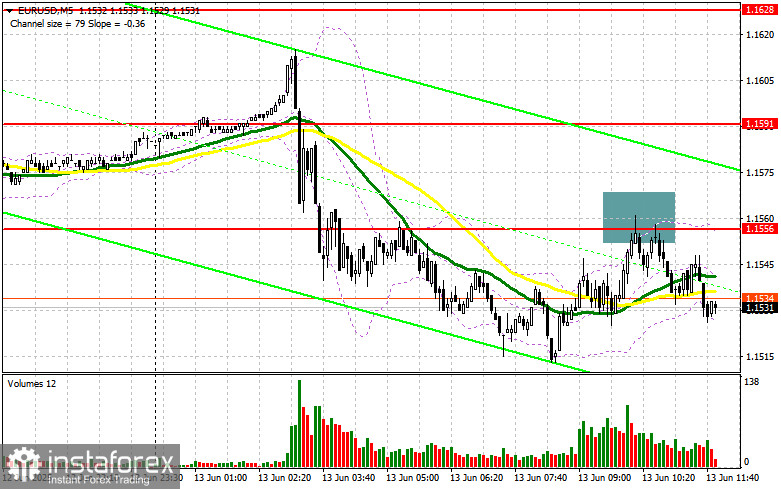
In the event of a euro decline, I will act according to the morning scenario: the focus remains on defending the 1.1507 support level, formed based on yesterday's results. A false breakout at this level would be a signal to buy EUR/USD, aiming for further bullish development and a retest of the 1.1556 resistance. A breakout and retest of this area would confirm the entry point, with a target at 1.1591. The furthest upward target will be 1.1628, where I plan to take profits.
If EUR/USD declines and there is no buyer activity around 1.1507, pressure on the pair will increase, potentially pushing it toward 1.1456. Only after a false breakout there will I consider long entries. Alternatively, I'll open long positions on a direct rebound from 1.1408, targeting a 30–35 point intraday correction.
To Open Short Positions on EUR/USD:
Sellers showed themselves in the first half of the day around 1.1556, which suggests that market anxiety remains. If the pair makes another push higher, a false breakout at that level — similar to the earlier one — would provide a signal to open short positions, targeting 1.1507. A breakout and consolidation below this range would confirm further selling toward 1.1456. The furthest downward target will be 1.1408, where I plan to take profit.
If EUR/USD rises in the second half of the day and bears fail to act near 1.1556, buyers may push the pair higher to retest 1.1591. I will only consider selling there after a failed breakout. I plan to open short positions on a direct rebound from 1.1628, targeting a 30–35 point correction.
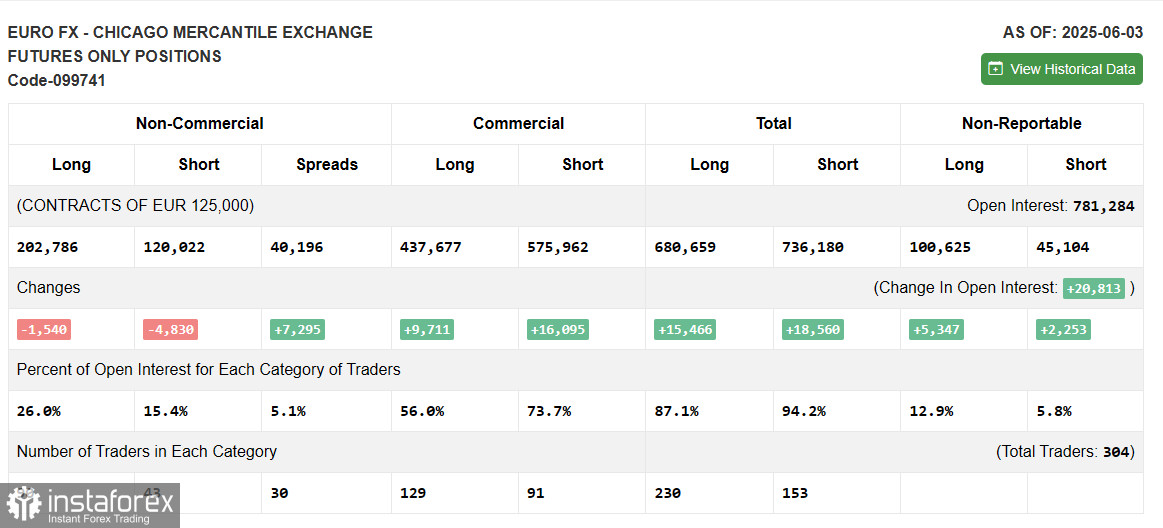
The COT (Commitments of Traders) report from June 3 showed a reduction in both long and short positions. The ECB's rate cut was fully anticipated, so it didn't alter the market's balance. Expectations that the central bank will now pause its easing cycle have supported the euro. A strong Eurozone GDP report also backs the case for further euro appreciation — so it's no surprise that short positions decreased more significantly than longs.
According to the COT report, long non-commercial positions fell by 1,540 to 202,786, while short positions dropped by 4,830 to 120,022. As a result, the gap between longs and shorts increased by 7,295.
Indicator Signals:
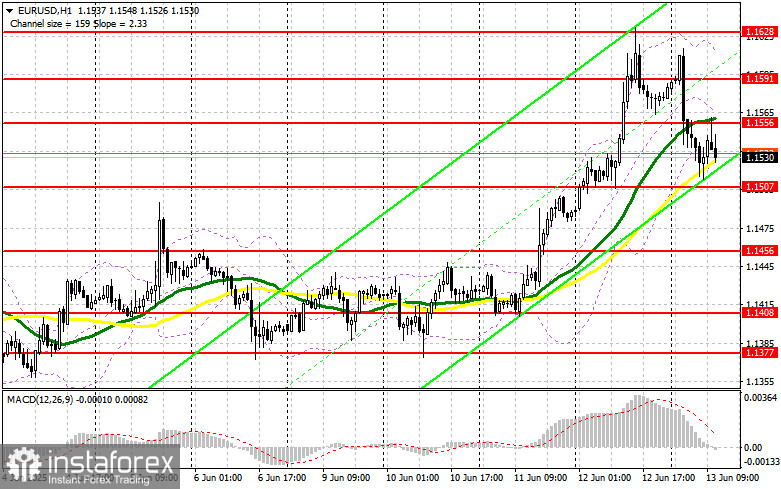
Moving AveragesTrading is occurring near the 30- and 50-period moving averages, which points to a sideways market.
Note: The author uses hourly (H1) chart settings, which differ from standard daily (D1) moving averages.
Bollinger Bands If the pair declines, the lower boundary of the indicator near 1.1510 will act as support.
Indicator Descriptions:
InstaForex analytical reviews will make you fully aware of market trends! Being an InstaForex client, you are provided with a large number of free services for efficient trading.


