 Maradok
Kereskedési feltételek
Products
Eszkozok


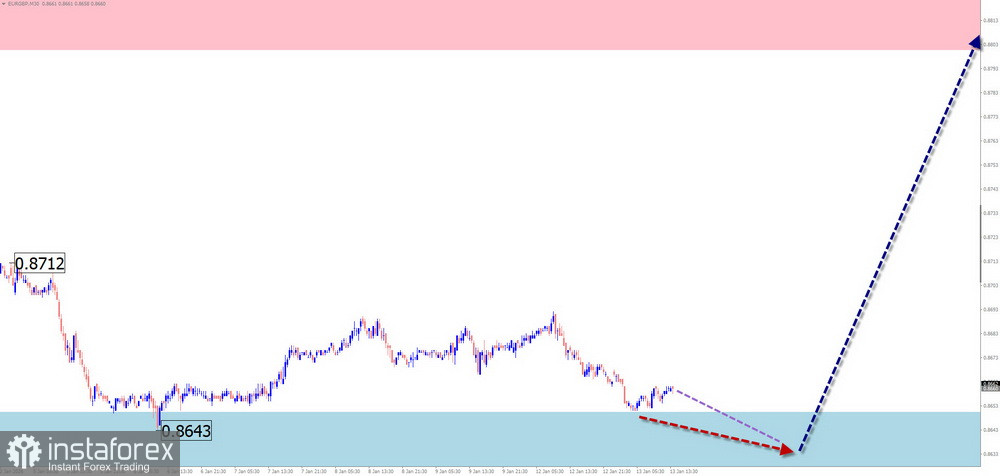
EUR/USD
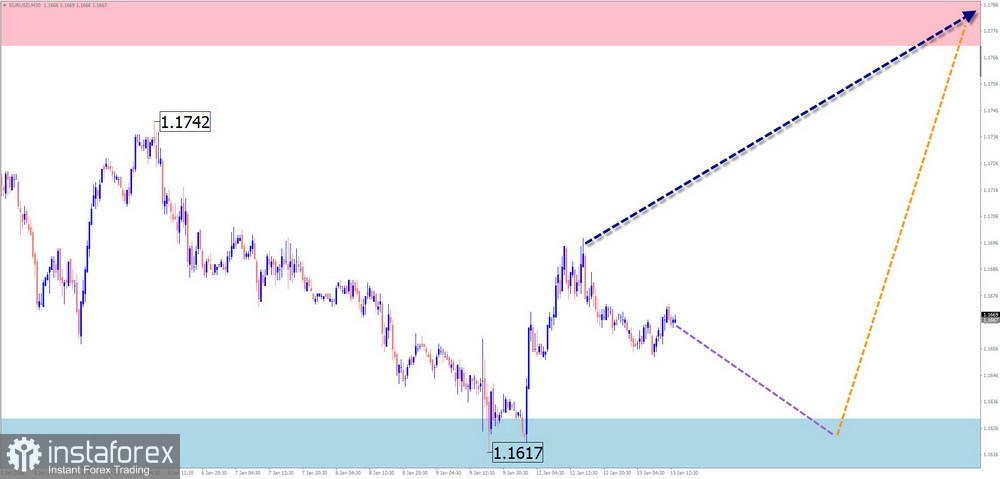
Within the broader bullish wave of the euro major, which has been unfolding since the beginning of last year, the pair's quotes have spent the past six months moving along the lower boundary of a strong potential reversal zone. At the time of analysis, the wave structure does not appear complete. Over the past three weeks, a corrective pullback to the downside has been developing.
In the near term, continued sideways movement of the euro is expected. Following a probable attempt to test the lower reversal zone, a change in direction and a rise toward the resistance area may occur. During the directional shift, a brief break below the lower boundary of the projected support cannot be ruled out.
Resistance:
Support:
Sell positions: fairly risky and may lead to deposit losses.Buy positions: may become viable after confirmed reversal signals appear on the trading systems you use near the support area.
USD/JPY
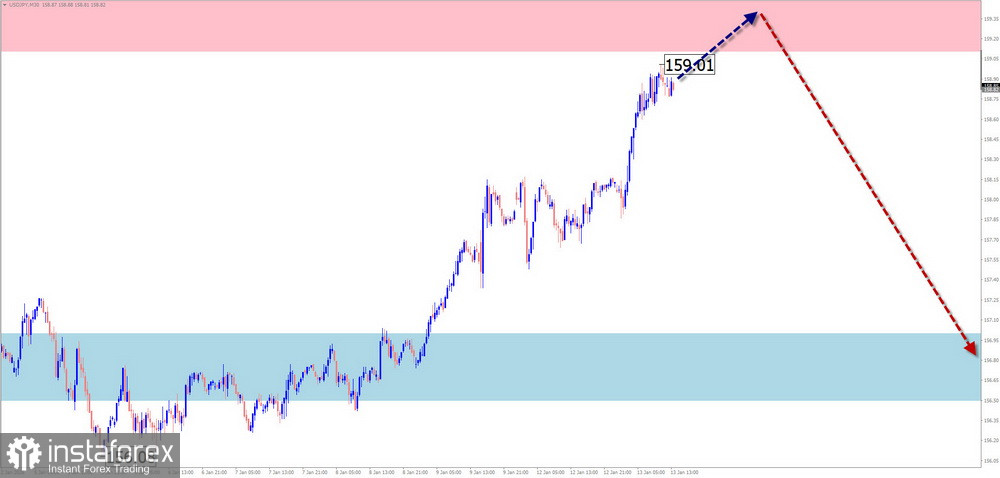
Since October of last year, the Japanese yen major has mostly been moving higher, forming an extended ascending flat. The wave structure lacks its final segment (C). In recent weeks, a corrective pullback has been forming from an intermediate resistance zone, predominantly in a sideways manner.
Over the coming week, there is a high probability that the overall sideways price movement will persist. In the first few days, short-term pressure on the resistance zone is possible, after which a change in direction and the start of a decline may follow. The support area marks the lower boundary of the pair's preliminary weekly range.
Resistance:
Support:
Buy positions: fairly risky and may result in deposit losses.Sell positions: after confirmed reversal signals appear, small position sizes may be used to seek profits.
GBP/JPY
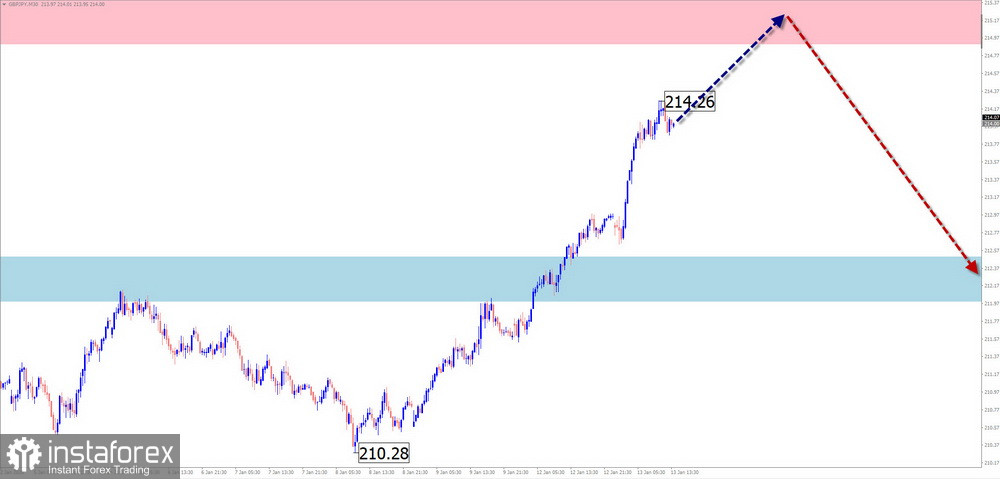
On the GBP/JPY pair chart, the short-term trend direction has been defined by a bullish wave that began on November 5 of last year. This price segment completes a larger-scale wave structure. At present, the price has reached the lower boundary of a strong potential reversal zone on a higher timeframe.
During the current week, the ongoing upward price movement is expected to complete. Before a trend reversal, pressure on the upper boundary of the resistance zone is possible over the next couple of days. An increase in volatility and the start of an active price decline are more likely toward the end of the week.
Resistance:
Support:
Buy positions: risky and may be unprofitable.Sell positions: may be used after appropriate reversal signals appear near the resistance area.
USD/CAD
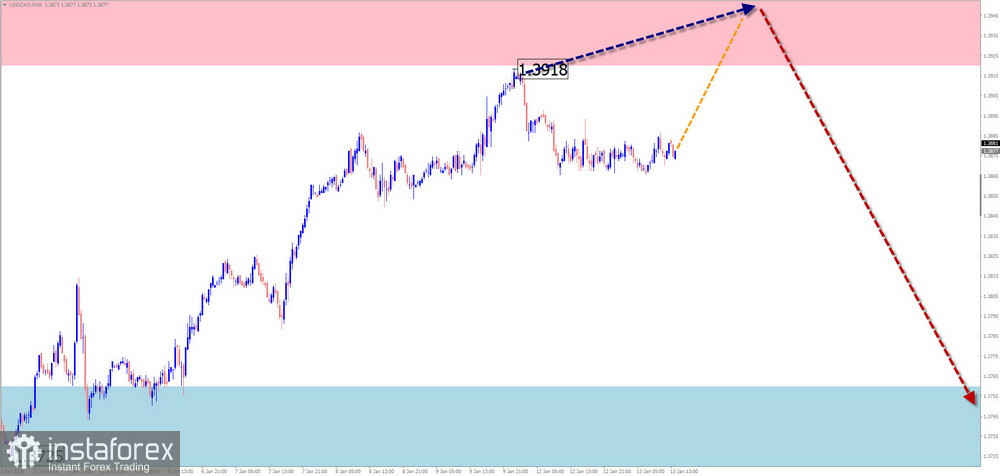
The primary direction of price fluctuations in the Canadian dollar major has been defined by a descending wave algorithm since February of last year. The unfinished segment of the main trend began on November 5. Since late December, a counter-wave structure has been developing, remaining within corrective boundaries.
At the beginning of the upcoming week, there is a high probability that the overall sideways price bias will persist. Pressure on the upper boundary of the projected resistance cannot be ruled out. With high probability, a reversal may then form, followed by a price decline toward the support zone.
Resistance:
Support:
Buy positions: have limited potential and carry a high level of risk.Sell positions: may become viable after appropriate reversal signals appear near the resistance area on the trading systems you use.
EUR/GBP
The current wave structure of the EUR/GBP pair is bearish and has been unfolding since April of last year. Since October, the pair has been trading in a range, forming the initial phase of the final wave segment (C). Quotes are confined to a narrow channel between strong potential reversal zones on the daily timeframe.
In the coming days, continued sideways movement can be expected. Near the support zone, a reversal is likely to form, followed by a resumption of upward movement. The highest activity is most likely closer to the weekend.
Resistance:
Support:
Buy positions: may be opened in fractional size after reversal signals appear near the support zone. Upward potential is limited by the resistance area.Sell positions: unpromising and risky.
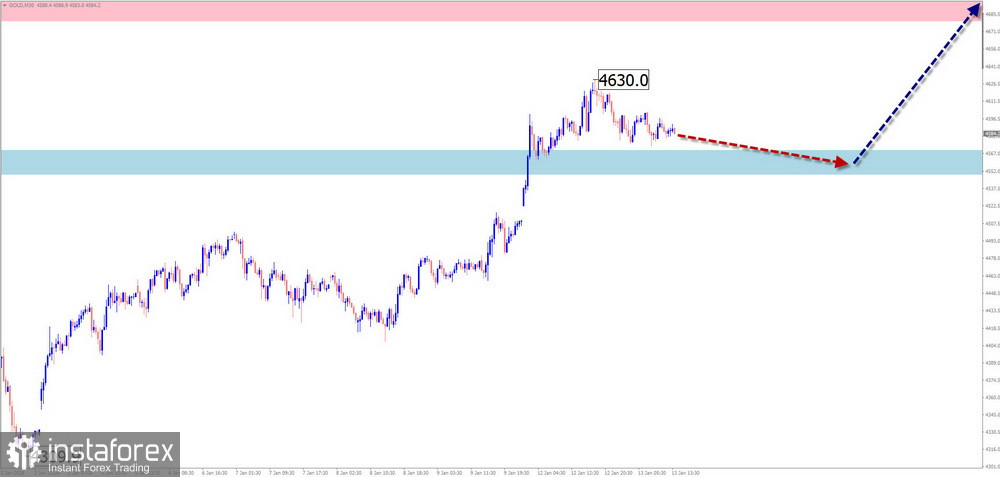
Gold
Gold prices are renewing the record highs seen at the end of last year. Within a larger wave structure, following a hidden correction, this segment has initiated another trend phase. A corrective pullback in the form of an extended flat is currently forming and remains unfinished at the time of analysis.
Over the coming week, there is a high probability that the overall sideways price bias will persist. In the first few days, pressure on the lower boundary of the support zone is possible. Thereafter, with high probability, a reversal may form, followed by the start of a decline. The expected downside range is capped by the projected resistance.
Resistance:
Support:
Buy positions: have limited potential and carry a high level of risk.Sell positions: may become viable after appropriate reversal signals appear near the projected support zone on the trading systems you use.
Explanations
In simplified wave analysis (SWA), all waves consist of three segments (A–B–C). On each timeframe, the most recent unfinished wave is analyzed. Dotted lines indicate expected price movements.
The wave algorithm does not take the duration of price movements over time into account.
InstaForex analytical reviews will make you fully aware of market trends! Being an InstaForex client, you are provided with a large number of free services for efficient trading.


