 Maradok
Kereskedési feltételek
Products
Eszkozok


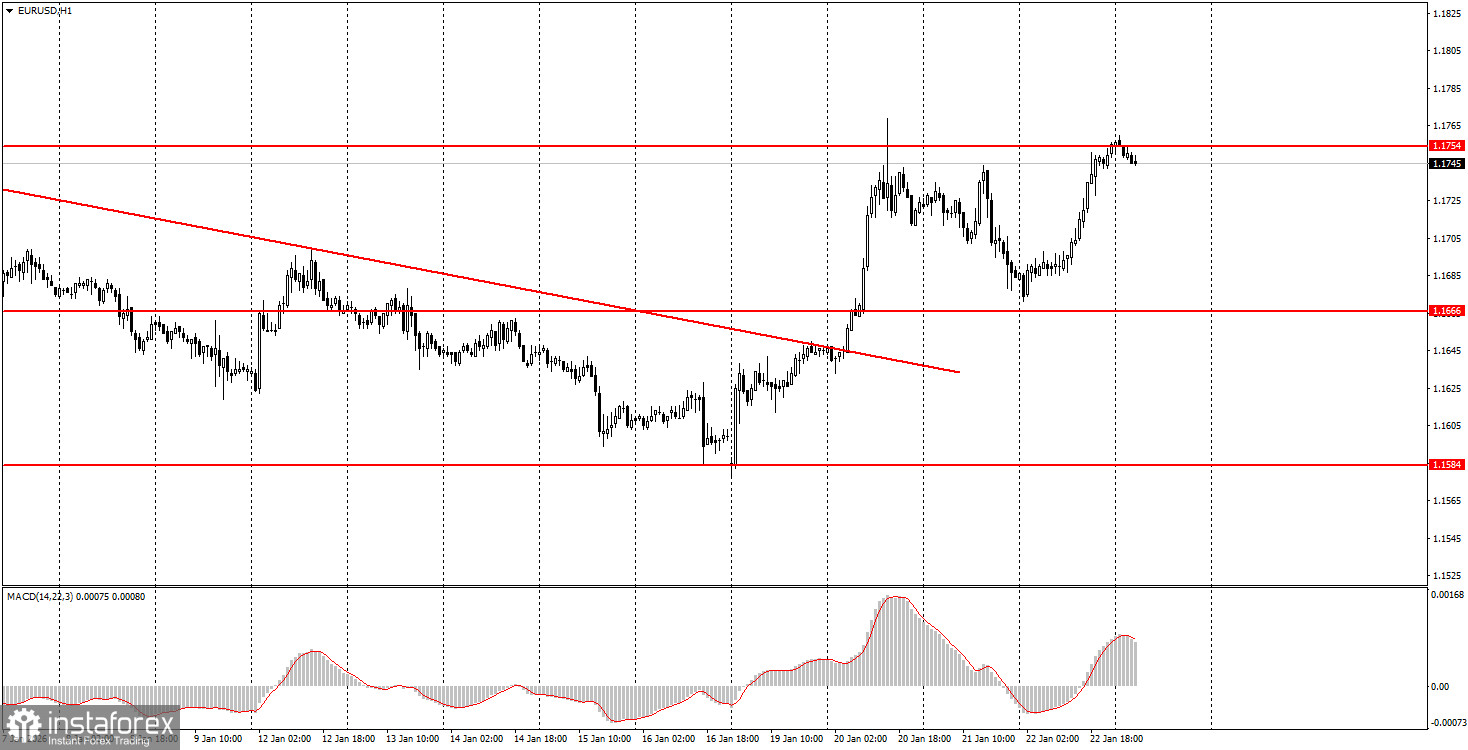
The EUR/USD currency pair traded higher for almost the entire day on Thursday. By the end of the day, the European currency returned to the level of 1.1754, which is just a stone's throw from the upper boundary of the sideways channel 1.1400-1.1830, where the pair has been for seven months. The reasons for the euro's growth may not be obvious to many traders. Yesterday, it became known that Trump canceled the tariffs he was going to impose on the EU and the UK starting February 1 due to their refusal to recognize U.S. rights to Greenland. It seemed that geopolitical tension had eased, and there would be no new trade war between the EU and the U.S. (for now). Nevertheless, the dollar fell all day. The same applies to the U.S. GDP report for the third quarter. Once again, forecasts were exceeded, but the market paid no attention to this report. What is the problem? The problem is that the market is tired of reacting to Trump's "news swings," and very few believe the current U.S. economic growth rates, given the dismal state of the U.S. labor market. The dollar must fall regardless due to Trump's policies. A seven-month flat is a gift from traders to the American currency.
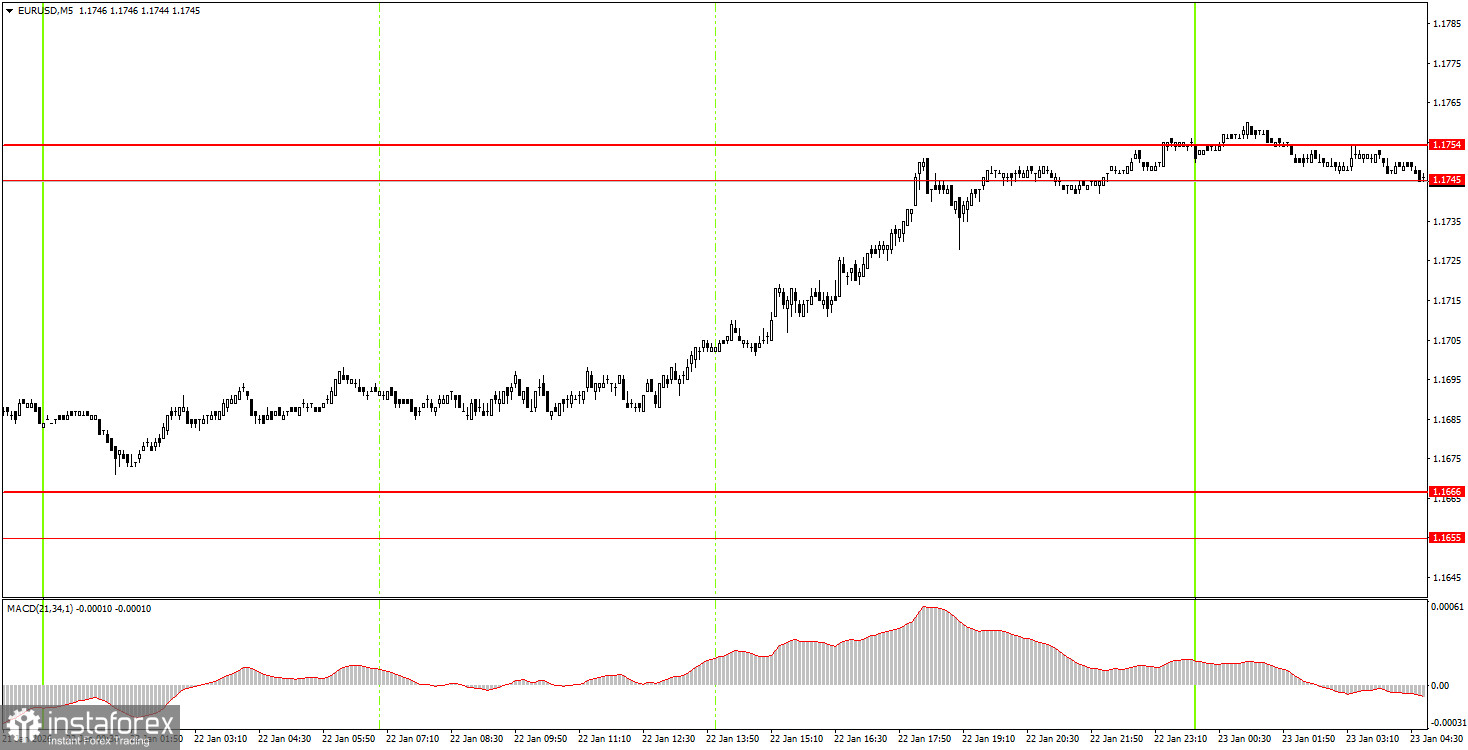
On the 5-minute timeframe, no trading signals were formed on Thursday. Unfortunately, the pair fell short of the 1.1666 level by just 5 pips during the Asian session. Otherwise, a great buy signal would have been formed.
On the hourly timeframe, the trend has changed to upward. Thus, in the near future, the pair may return to the upper boundary of the sideways channel 1.1400-1.1830 to attempt to break through it again and finally end the seven-month flat. The overall fundamental and macroeconomic background remains very weak for the U.S. dollar, but the flat on the daily timeframe takes priority, while traders pay little attention to the macroeconomic background.
On Friday, beginner traders can open new long positions if the area of 1.1745-1.1754 is broken with a target of 1.1800-1.1830. A price rebound from the area of 1.1745-1.1754 will allow for short positions with a target of 1.1655-1.1666.
On the 5-minute timeframe, levels to consider are: 1.1354-1.1363, 1.1413, 1.1455-1.1474, 1.1527-1.1531, 1.1550, 1.1584-1.1591, 1.1655-1.1666, 1.1745-1.1754, 1.1808, 1.1851, 1.1908, 1.1970-1.1988. Today, activity indices for the manufacturing and services sectors for January will be published in the Eurozone, Germany, and the U.S. Additionally, Christine Lagarde will speak in Europe, and the University of Michigan's consumer sentiment index will be released in the U.S.
Support and resistance price levels — levels that serve as targets when opening buys or sells. Take Profit can be placed near them.
Red lines — channels or trendlines that reflect the current tendency and show which direction is preferable to trade now.
MACD indicator (14,22,3) — histogram and signal line — an auxiliary indicator that can also be used as a source of signals.
Important speeches and reports (always listed in the news calendar) can strongly affect a currency pair's movement. Therefore, during their release, trading should be done with maximum caution, or positions should be closed, to avoid a sharp price reversal against the preceding move.
Beginner forex traders should remember that not every trade can be profitable. Developing a clear strategy and effective money management are the keys to long-term trading success.
InstaForex analytical reviews will make you fully aware of market trends! Being an InstaForex client, you are provided with a large number of free services for efficient trading.


