empty
 
 
Ön épp elhagyja a weblapot
www.instaforex.eu >
a weblap üzemeltetője a(z)
INSTANT TRADING EU LTD
Számlanyitás

18.02.202612:37 Forex-elemzések és áttekintések: GBP/USD. Analysis and Forecast

Relevance up to 05:00 2026-02-19 UTC--5
Ezeket az információkat marketingkommunikációnk részeként küldjük el lakossági és professzionális ügyfeleink számára. Nem tartalmaznak és nem tekintendők befektetési tanácsnak vagy javaslatnak, sem bármilyen pénzügyi instrumentummal való tranzakcióra vagy kereskedési stratégia használatára irányuló ajánlatnak vagy felkérésnek. A korábbi teljesítmény nem garantálja vagy jósolja meg a jövőbenit. Az Instant Trading EU Ltd. nem képviseli vagy garantálja a szolgáltatott információk pontosságát vagy teljességét, illetve nem felelős bármely, az elemzéseken, előrejelzéseken vagy a Vállalat munkatársa által adott információkon alapuló befektetések esetleges veszteségéért. A teljes felelősségkizárás itt található.

Exchange Rates 18.02.2026 analysis

The GBP/USD pair is struggling to build on yesterday's rebound from a new February low, which formed slightly below the psychological 1.3500 level. However, pressure from negative factors is being partially offset, as market participants appear to be avoiding aggressive directional positions ahead of the release of the FOMC meeting minutes.

At the same time, despite more encouraging UK economic data today, the disappointing employment figures released on Tuesday strengthened expectations of a Bank of England rate cut in March, weighing on the British pound.

Moderate strengthening of the U.S. dollar is also limiting GBP/USD's upside. Nevertheless, the dovish outlook for the Federal Reserve could restrain further dollar gains and help reduce losses for the currency pair.

Exchange Rates 18.02.2026 analysis
From a technical perspective, yesterday's break below the 200-period simple moving average (SMA) on the 4-hour timeframe was seen as a key signal for GBP/USD bears. However, prices are now attempting to move back above and consolidate over the 200-period SMA on the 4-hour chart. The MACD indicator shows the histogram in negative territory. The Relative Strength Index (RSI) is also in negative territory, recovering from the oversold zone.

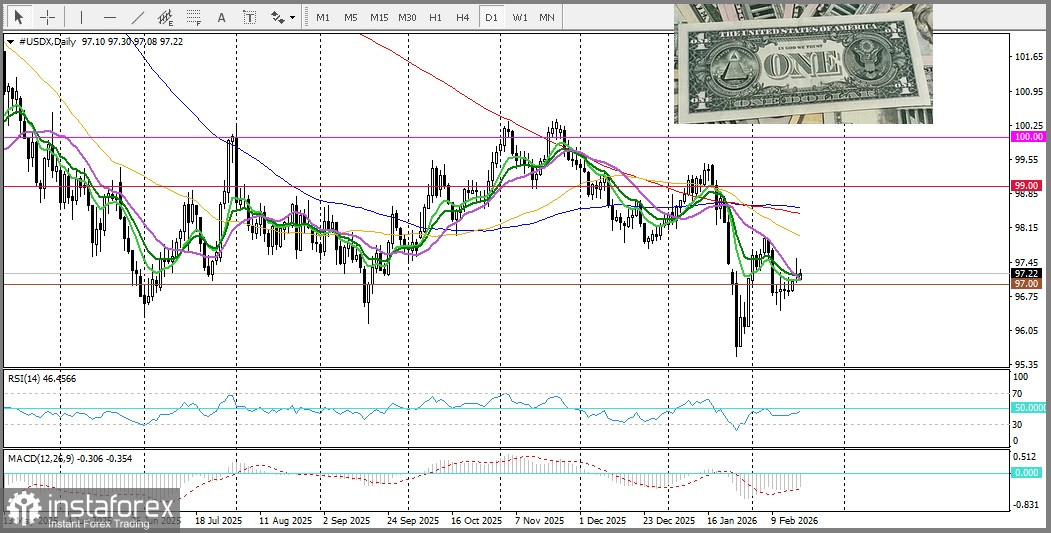
The 200-period SMA is showing moderate upward movement, and GBP/USD is slightly trading above it but facing resistance at the 9-period EMA. A break above this barrier would strengthen bullish momentum. Otherwise, if the pair falls back below the 200-period SMA, it could activate sellers and lead to further declines. It is also worth noting that on the daily chart, the RSI has moved into negative territory, indicating weakness among the bulls.

Irina Yanina
Analytical expert of InstaForex
© 2007-2026

Open trading account

InstaForex analytical reviews will make you fully aware of market trends! Being an InstaForex client, you are provided with a large number of free services for efficient trading.


Most elhagyja a www.instaforex.eu weblapot, amelyet az Instant Trading EU LTD üzemeltet
Can't speak right now?
Ask your question in the chat.
Widget callback

Turn "Do Not Track" off