 Maradok
Kereskedési feltételek
Products
Eszkozok


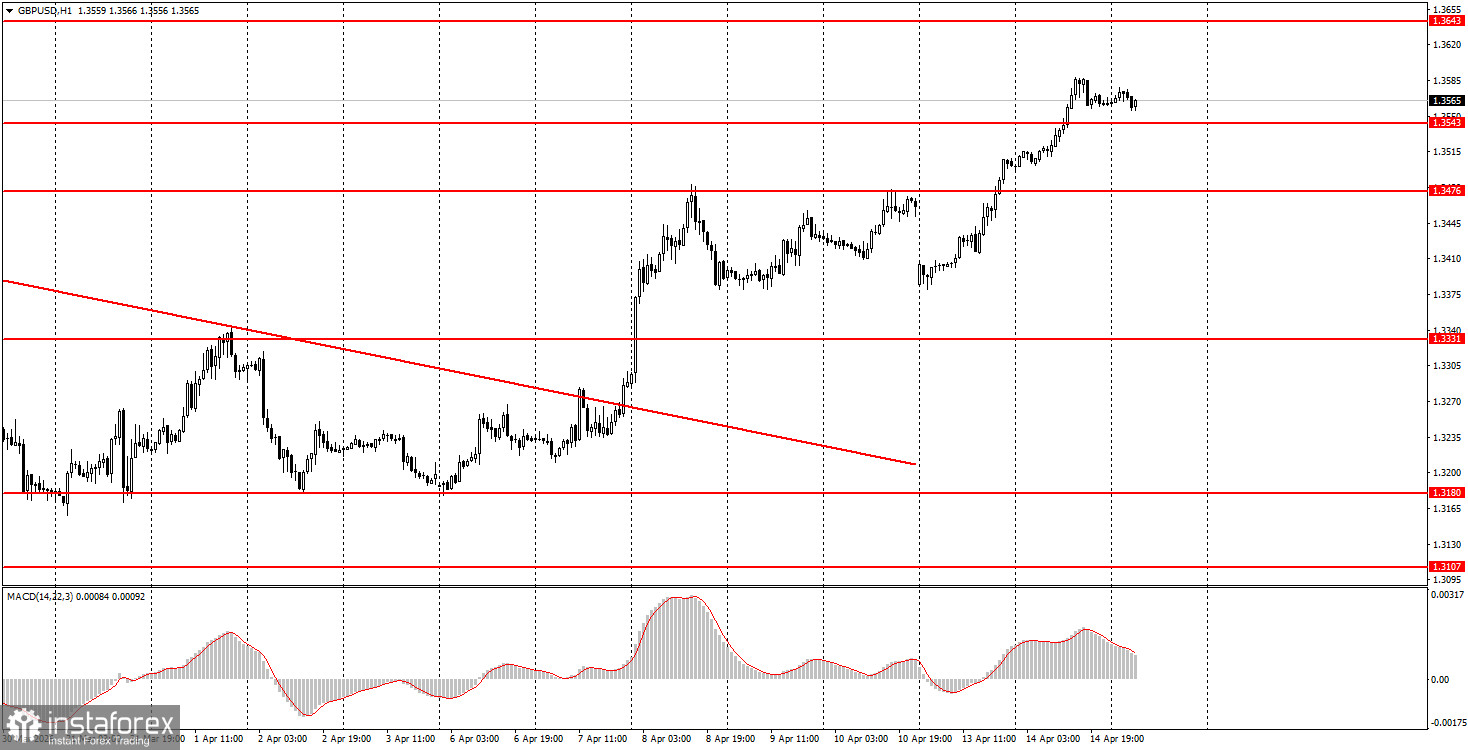
The GBP/USD pair continued its upward movement on Tuesday, driven by the diminishing influence of geopolitical factors on market sentiment. While positive news continues to come from the Middle East, we believe that the main key issues of the conflict remain unresolved. Therefore, there are a few reasons for optimism. The Strait of Hormuz remains blocked (by both the U.S. and Iran), the issue of Tehran's nuclear developments and weapons is unresolved, and hostilities could flare up again at any moment since the end of the war that Trump mentioned pertains to the U.S., not all countries in the Middle East. Nonetheless, the market sees grounds for optimism, and no military actions are currently taking place. There is a chance of gradual stabilization in energy prices, and the dollar has lost its only trump card in the battle against the euro and the pound.
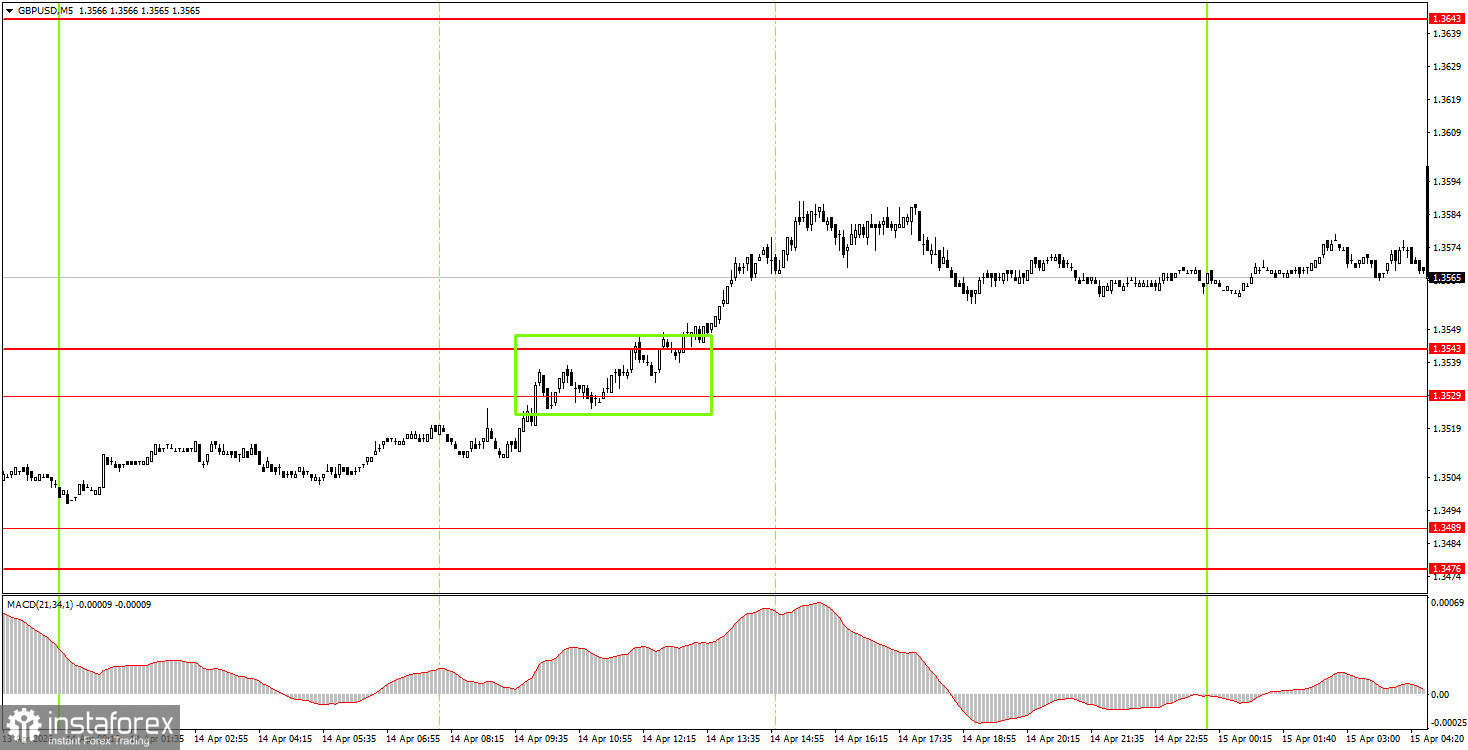
On the 5-minute timeframe, exactly one buying signal was formed on Tuesday. During the European trading session, the pair crossed the 1.3529-1.3543 area, triggering a further rise in the British currency and providing novice traders with an excellent opportunity to open long positions. These positions can reasonably be held today with a target of 1.3643.
On the hourly timeframe, the GBP/USD pair continues to form an upward trend. There are no global grounds for medium-term dollar growth; therefore, we expect a resumption of the global upward trend of 2025 in 2026. For this to happen, geopolitical tensions worldwide need to continue to decrease, but there is another scenario: the market may simply turn a blind eye to geopolitics after two months of trading primarily on this factor.
On Wednesday, novice traders may open short positions if the price consolidates below the 1.3529-1.3543 range, targeting 1.3476-1.3489. Consolidation above the area of 1.3529-1.3543 allows for maintaining long positions with a target of 1.3643-1.3652.
On the 5-minute timeframe, trading can now occur at 1.3175-1.3180, 1.3259-1.3267, 1.3319-1.3331, 1.3380-1.3386, 1.3476-1.3489, 1.3529-1.3543, 1.3643-1.3652, 1.3695, and 1.3741-1.3751. Today, Bank of England Governor Andrew Bailey will give a speech in the UK, and only a few minor reports will be published in the U.S. Therefore, novice traders can focus on technical factors for trading today.
Price levels of support and resistance are levels that serve as targets when opening buys or sells. Take Profit levels can be placed around them.
Red lines represent channels or trend lines that show the current trend and indicate the direction in which it is preferable to trade now.
The MACD indicator (14,22,3) – the histogram and the signal line – is a supporting indicator that can also be used as a source of signals.
Important speeches and reports (always included in the news calendar) can significantly affect the movement of the currency pair. Therefore, during their release, trading should be done with utmost caution, or traders should exit the market to avoid sharp price reversals against the previous movement.
Beginning traders in the forex market should remember that not every trade can be profitable. Developing a clear strategy and effective money management are the keys to long-term trading success.
InstaForex analytical reviews will make you fully aware of market trends! Being an InstaForex client, you are provided with a large number of free services for efficient trading.


