 Maradok
Kereskedési feltételek
Products
Eszkozok


The EUR/USD currency pair showed a minor correction on Thursday, but the upward trend remained intact. The macroeconomic background yesterday was again very weak, with the only noteworthy report being the second estimate of inflation in the European Union, which came in at 2.6% for March, slightly above initial forecasts. However, the March inflation increase was anticipated, so traders paid little attention to macroeconomic data. Geopolitical conditions remain complex and contradictory. Donald Trump speaks almost every day about negotiations with Iran and an agreement, but there is currently no concrete information available. It is unknown how negotiations will end or if they will even take place this week. As a result, the market paused "until the circumstances are clarified." In general, if the conflict in the Middle East does not escalate into war, the geopolitical factor will recede into the background, and in this case, we expect the continuation of the trend from 2025.
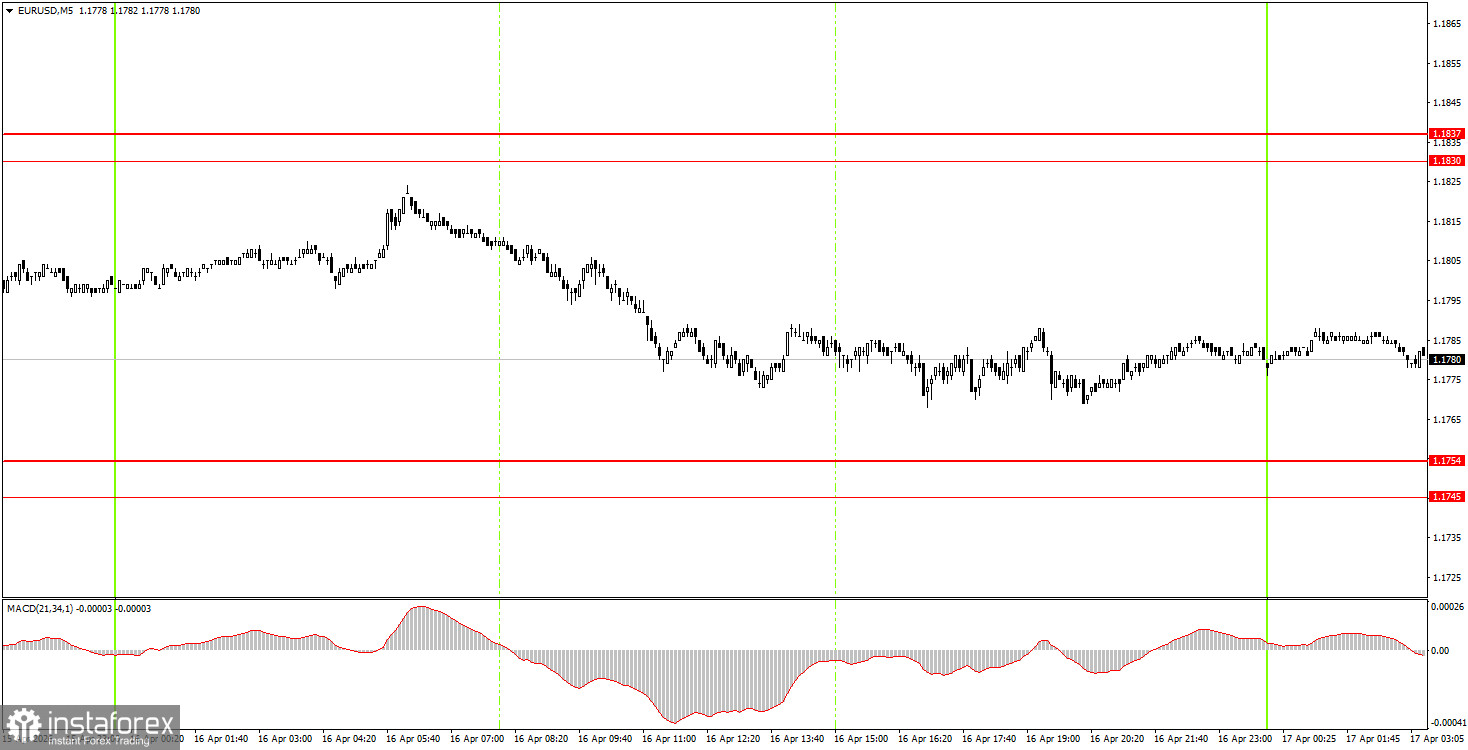
On the 5-minute timeframe, no trading signals were formed on Thursday. Throughout the day, the pair did not approach any of the levels or areas closely. Thus, there were no grounds for novice traders to open new trades.
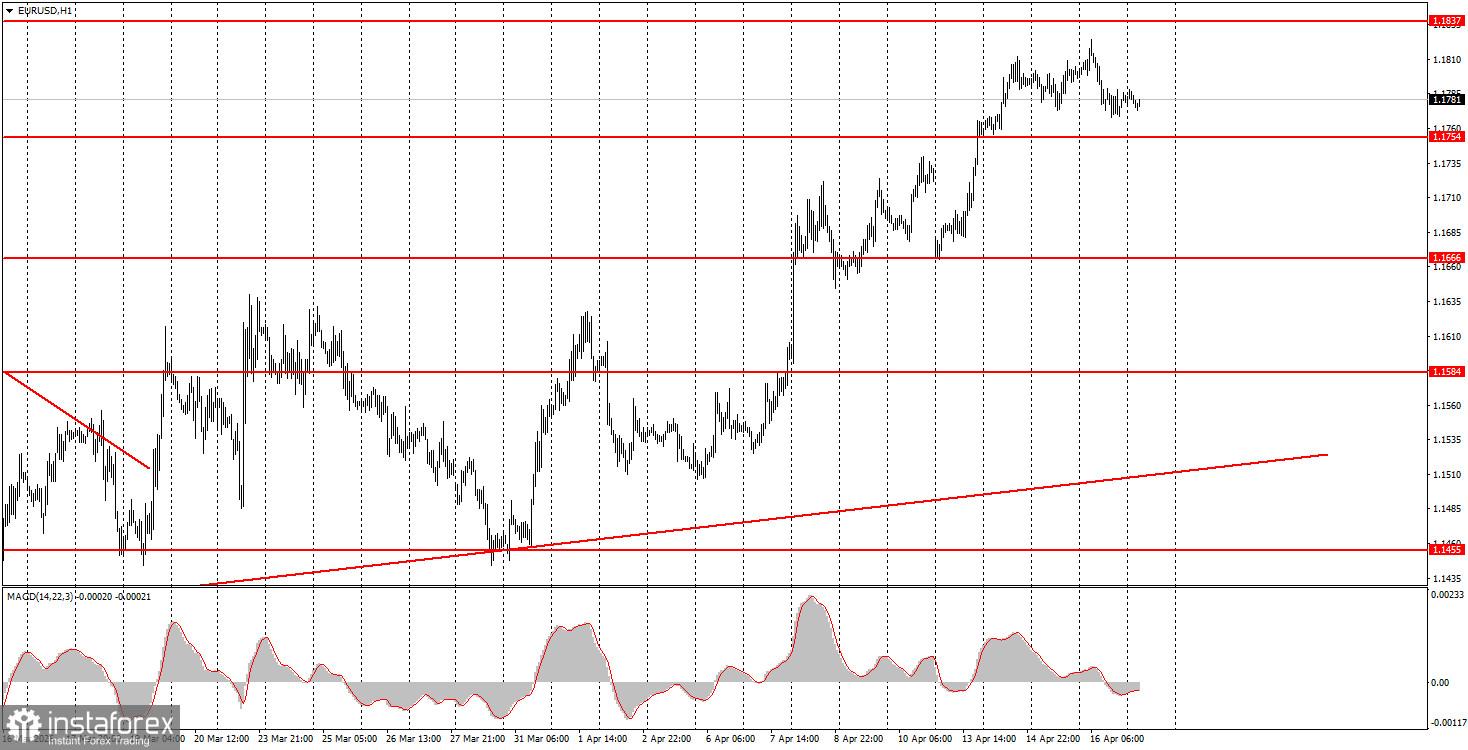
On the hourly timeframe, the upward trend remains. After two months of continuous dollar growth driven solely by geopolitical factors, the market seems to have concluded that this cannot continue forever. For two consecutive weeks, the market has been selling off the dollar as geopolitics takes a back seat. Traders can once again focus on the economy and Trump's policies, where the U.S. dollar has few advantages. This week, however, there have been few significant events.
On Friday, novice traders may consider short positions if the price consolidates below the 1.1745-1.1754 range, targeting 1.1655-1.1666. New buy trades can be considered on a rebound from the 1.1745-1.1754 area, targeting 1.1830-1.1837.
On the 5-minute timeframe, levels to consider include 1.1354-1.1363, 1.1413, 1.1455-1.1474, 1.1527-1.1531, 1.1584-1.1591, 1.1655-1.1666, 1.1745-1.1754, 1.1830-1.1837, and 1.1899-1.1908. On Friday, the event calendars for both the Eurozone and the U.S. are completely empty. Therefore, traders will be left waiting for news about negotiations between Iran and the U.S., as well as between Lebanon and Israel.
Price levels of support and resistance are levels that serve as targets when opening buys or sells. Take Profit levels can be placed around them.
Red lines represent channels or trend lines that show the current trend and indicate the direction in which it is preferable to trade now.
The MACD indicator (14,22,3) – the histogram and the signal line – is a supporting indicator that can also be used as a source of signals.
Important speeches and reports (always included in the news calendar) can significantly affect the movement of the currency pair. Therefore, during their release, trading should be done with utmost caution, or traders should exit the market to avoid sharp price reversals against the previous movement.
Beginning traders in the forex market should remember that not every trade can be profitable. Developing a clear strategy and effective money management are the keys to long-term trading success.
InstaForex analytical reviews will make you fully aware of market trends! Being an InstaForex client, you are provided with a large number of free services for efficient trading.


