 Maradok
Kereskedési feltételek
Products
Eszkozok


The GBP/USD currency pair also traded higher throughout the day on Friday, recovering losses from the previous day. Earlier, news emerged that the US and Iran had again violated the conditions of the truce, prompting the market to cautiously purchase some safe-haven dollars. However, by Friday, both sides of the conflict made statements indicating that the "minor misunderstanding" on Thursday would not affect the truce and negotiations. Thus, the GBP/USD pair fully recovered all losses from Thursday.
Regarding the macroeconomic background, there is no point in analyzing it. The Nonfarm Payrolls report, which has long been one of the most important reports for the market, failed to spark any interest among traders. And there's no need to ask "why?" or look for various fantastical explanations. The market has been ignoring macroeconomics for three months.
On the hourly timeframe, the upward trend persists. The price is located above the Ichimoku indicator lines, but there is no trend line. The price often rejects downward, reacting to local geopolitical events. Just last week, Iran and the US each breached the terms of the truce twice, prompting sharp declines.
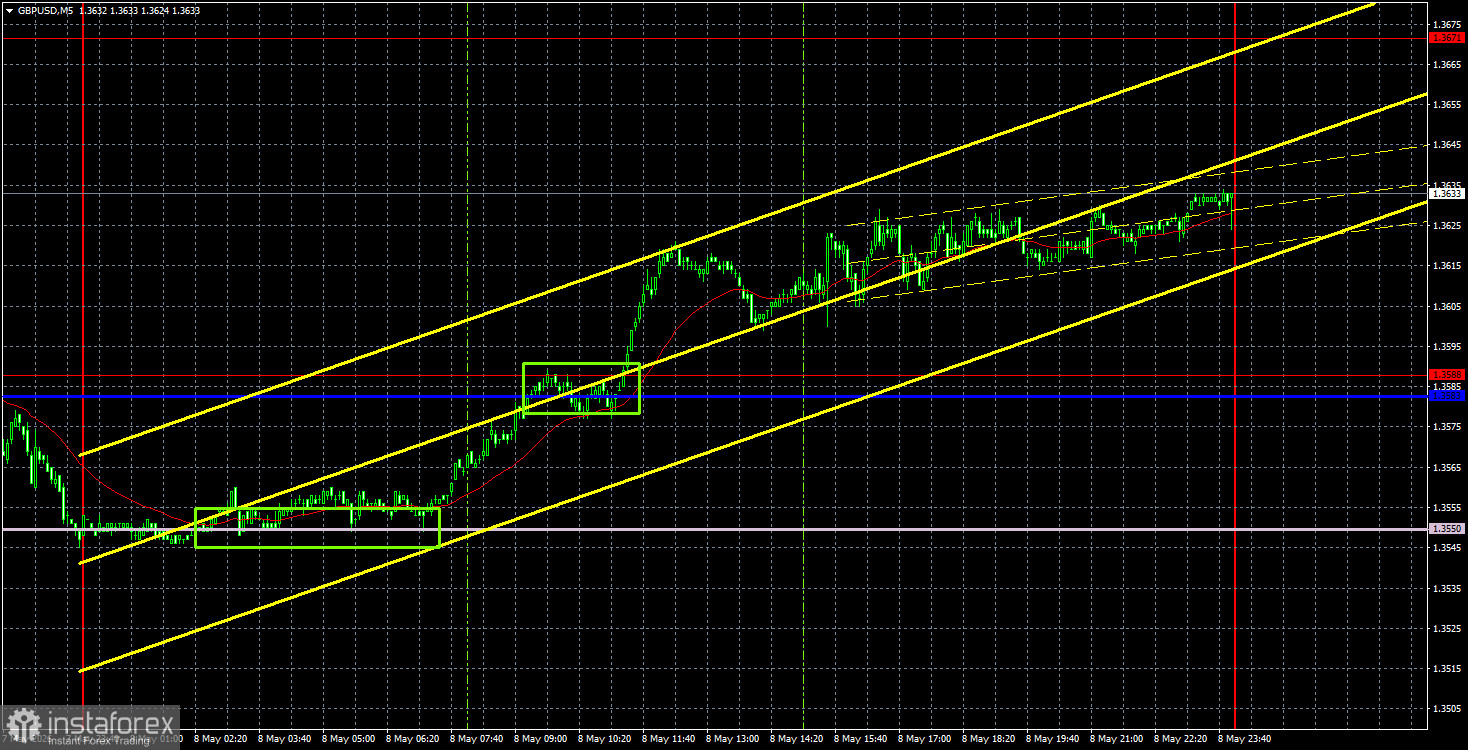
On the 5-minute timeframe, two trading signals were formed on Friday. Initially, the pair bounced off the Senkou Span B line, then surpassed the 1.3583-1.3588 area. In both cases, traders could have opened long positions. In both instances, they would have realized profits.
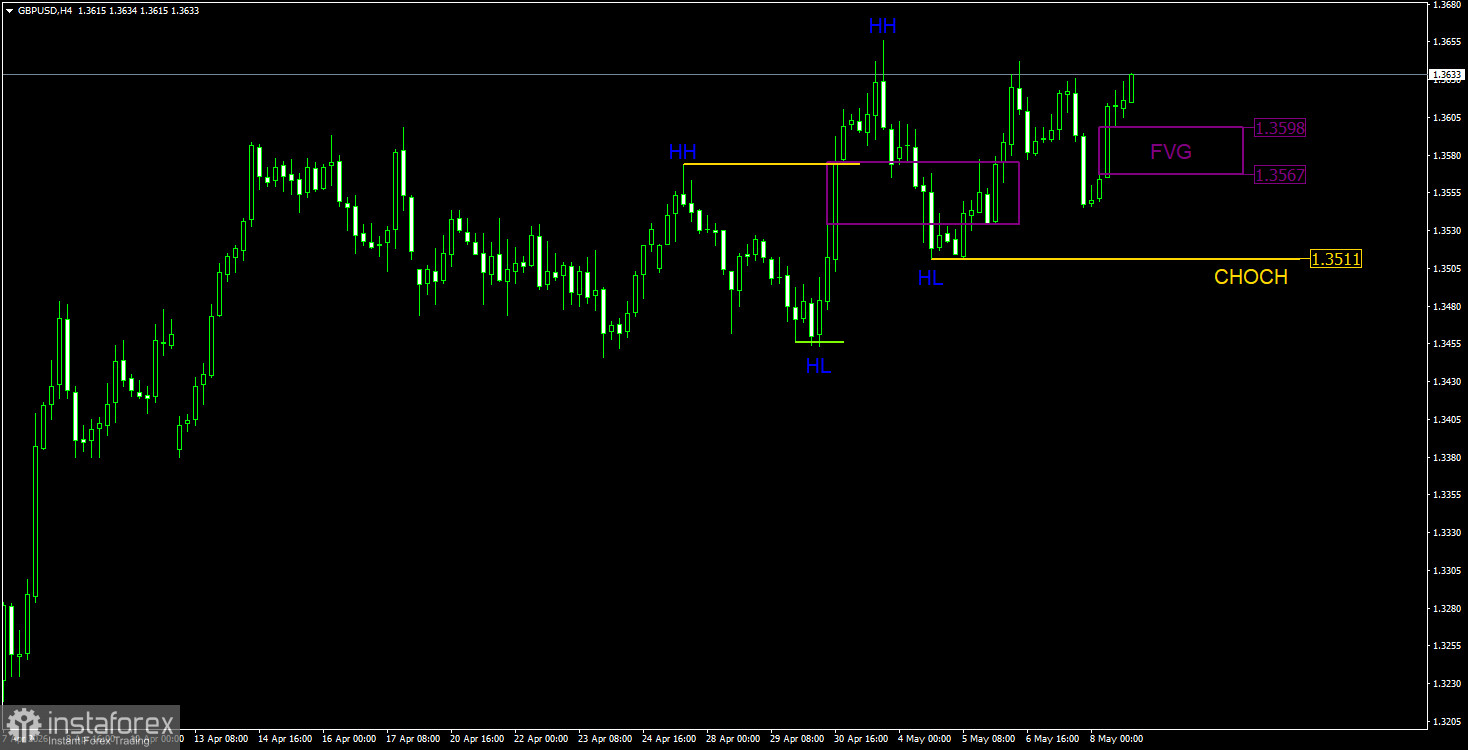
On the 4-hour timeframe, we analyze according to the ICT trading system. The exchange rate of the British pound strongly correlates with the euro, just as the price of Ethereum does with Bitcoin. Therefore, patterns and signals from EUR/USD should always be taken into account. For example, on May 5, the euro formed a signal from an Order Block, while the British pound did not. Nevertheless, both the euro and the pound showed growth. The trend on the 4-hour timeframe is also upward, and the CHOCH line is at 1.3511. Only below this level can we consider the upward trend broken. Until that time, we only look for buying signals. The most relevant pattern is the "bullish" FVG in the range of 1.3567-1.3598. This area serves as a POI for purchases in the early days of the new week. It is important to remember that various events can overshadow the technical picture (for instance, geopolitical events in recent months). Therefore, it is still advisable not to ignore the fundamentals and geopolitical factors. However, the working strategy on the 4-hour timeframe this week is to wait for a signal to form in the 1.3567-1.3598 area.
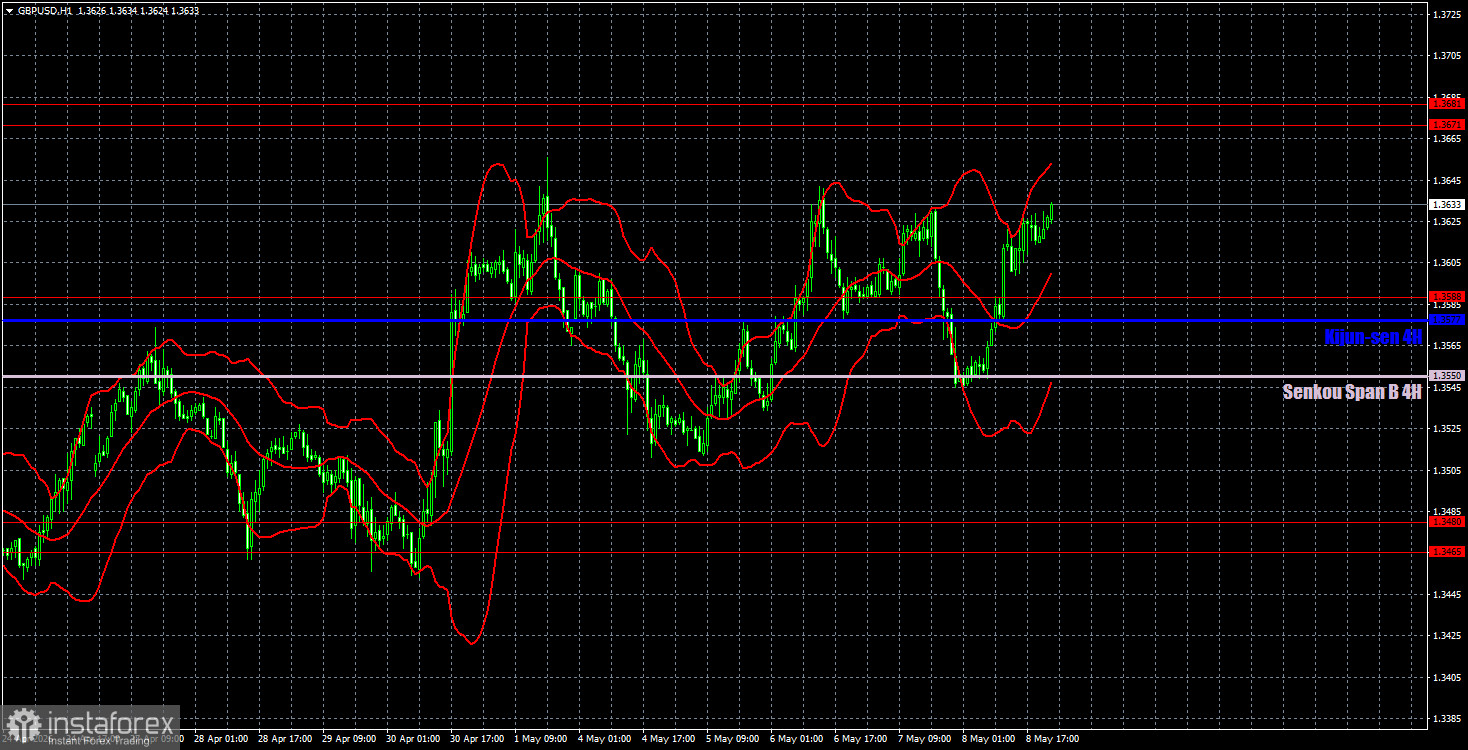
On the hourly timeframe, the GBP/USD pair continues to form an upward trend, which may be invalidated if the British pound settles below the Ichimoku indicator lines. The influence of geopolitics continues to weaken; the market is paying less attention to news from the Middle East, and the dollar has lost its only significant support. On Friday, even strong Nonfarm Payrolls did not help it.
For May 11, we identify the following important levels: 1.3096-1.3115, 1.3179-1.3187, 1.3369-1.3377, 1.3465-1.3480, 1.3588, 1.3671-1.3681, 1.3751-1.3763. The Senkou Span B line (1.3550) and Kijun-sen (1.3577) may also serve as sources of signals. It is recommended to set the Stop Loss order to breakeven if the price moves in the correct direction by 20 pips. The lines of the Ichimoku indicator may shift throughout the day, which should be taken into account when determining trading signals.
On Monday, there are no significant events scheduled in the UK, while in the US, there will be only a secondary report on home sales. Additionally, no news regarding the Middle East has emerged over the weekend, so we can expect dull trading and low volatility on Monday.
Today, traders may consider opening short positions if the price bounces from the 1.3671-1.3681 area, targeting 1.3588. Long positions can be maintained following the formation of buying signals from Friday, targeting the area between 1.3671 and 1.3681. On the 4-hour timeframe, we recommend closely monitoring the 1.3567-1.3598 range, where a buying signal may form.
InstaForex analytical reviews will make you fully aware of market trends! Being an InstaForex client, you are provided with a large number of free services for efficient trading.


