 Maradok
Kereskedési feltételek
Products
Eszkozok


The EUR/USD currency pair demonstrated super interesting movements on Thursday. The events of the day are worthy of the most honorable pages and sections of any trading textbook. Let's start with the European Central Bank meeting, where it was decided to raise rates for the first time in three years. Although this decision was known well in advance, the market did not react to it either last week or yesterday. Thus, at this time, central bank rate hikes are much less significant events than the recent shift in Donald Trump's rhetoric towards Iran.
Yesterday morning, information came in about new US strikes on Iran, and Trump accused Tehran of dragging out negotiations, announcing new strikes on Friday. Later in the evening, the US president stated that the strikes on Iran were canceled because... the parties are close to reaching a tremendous agreement. Curtain. The American comedy is not just gaining momentum; it is becoming funnier with each act. The market reacted to Trump's new statements with dollar sales. By 85 pips. That's all you need to know about how the market is moving right now.
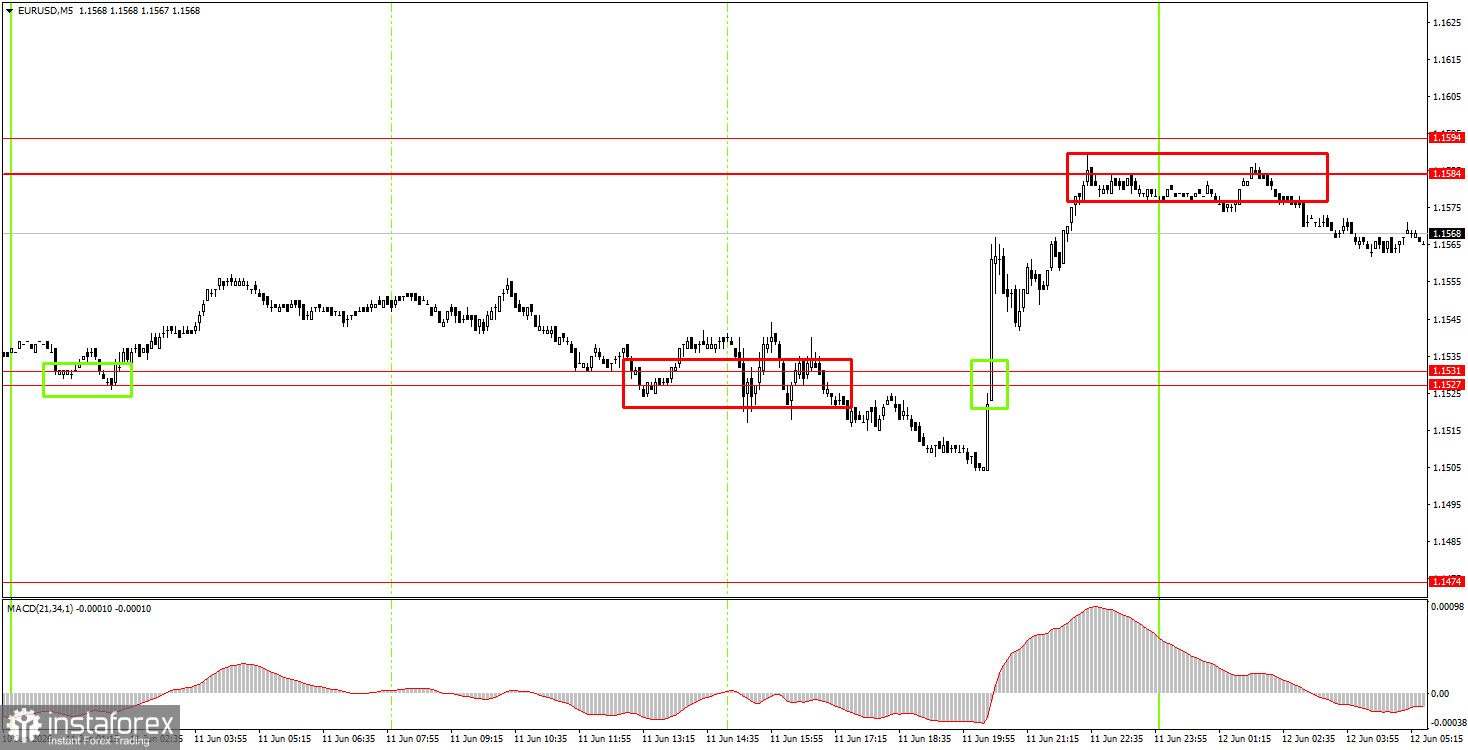
On the 5-minute timeframe, three trading signals were formed on Thursday. During the American session, after several hours of convulsions, the pair finally broke through the 1.1527-1.1531 area, but the drop did not last long. Trump once again took center stage, triggering a nearly 100-pip rise and forming a buy signal. During the night, the price bounced off the 1.1584-1.1594 area.
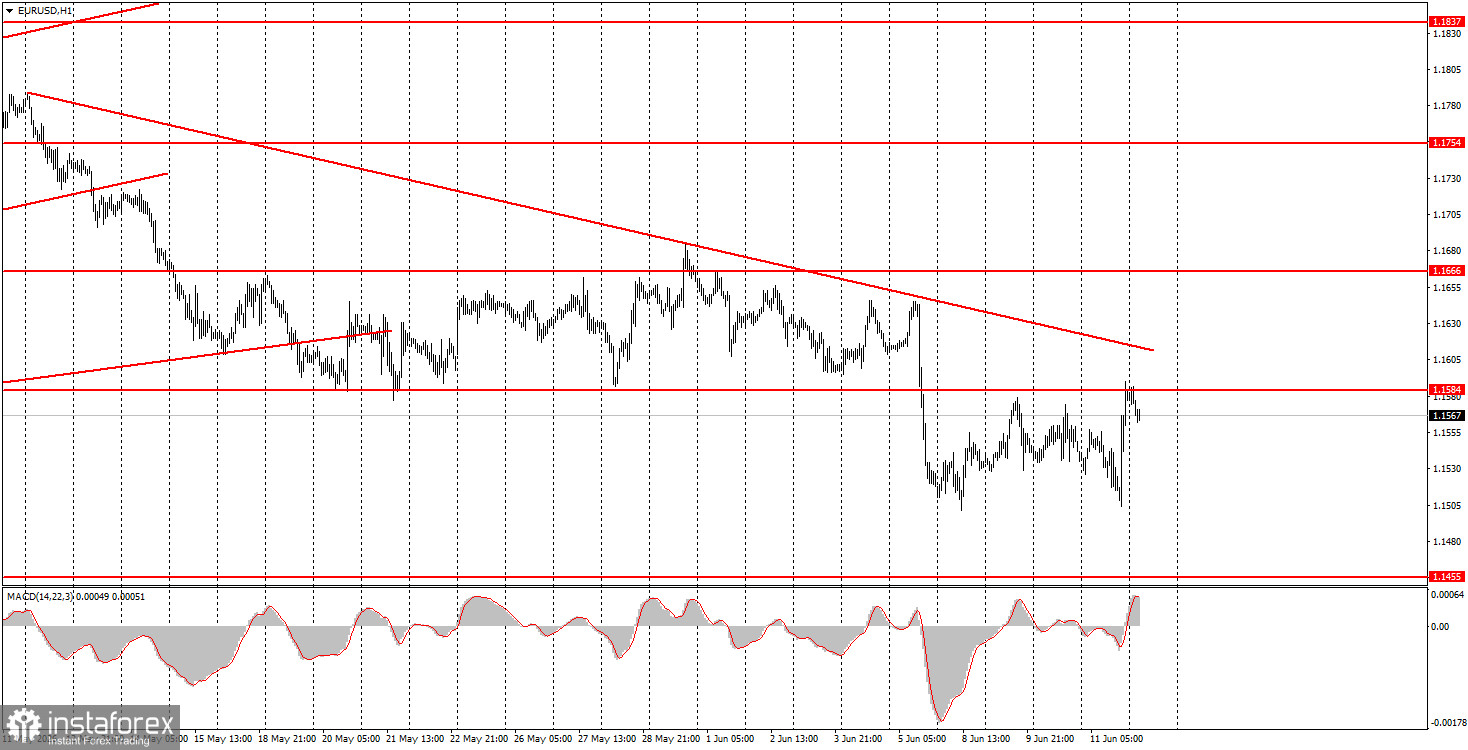
On the hourly timeframe, the flat has ended, and the downward trend has resumed after three weeks of stagnation, but any further US dollar growth will depend entirely on developments in geopolitical events. If full-scale war resumes in the Middle East, the dollar will continue to rise. If Tehran and Washington return to the negotiating table, this will support risk currencies.
On Friday, novice traders can open short positions targeting 1.1527-1.1531 if the price bounces from the 1.1584-1.1594 area. Long positions can be considered if the price consolidates above the 1.1584-1.1594 area, targeting 1.1655-1.1666.
On the 5-minute timeframe, the following levels should be considered: 1.1354-1.1363, 1.1413, 1.1455-1.1474, 1.1527-1.1531, 1.1584-1.1594, 1.1655-1.1666, 1.1745-1.1754, 1.1830-1.1837, 1.1899-1.1908. On Friday, no important events are scheduled in the Eurozone, while the only report in the US will be the University of Michigan's consumer sentiment index. However, the market's attention will again be directed towards geopolitics. There are currently no other factors affecting the market.
Price levels (areas) of support and resistance are targets when opening long or short positions or sources of signals.
Red lines indicate channels or trend lines that display the current trend and indicate the preferred direction for trading.
The MACD indicator (14,22,3) – histogram and signal line – is a supplementary indicator that can also be used as a source of signals.
Important speeches and reports (contained in the news calendar) can significantly impact the movement of the currency pair. Therefore, during their release, trading should be conducted with maximum caution, or one should exit the market to avoid sharp reversals against preceding movements.
Beginners trading in the forex market should remember that not every trade can be profitable. Developing a clear strategy and practicing money management are key to long-term success in trading.
InstaForex analytical reviews will make you fully aware of market trends! Being an InstaForex client, you are provided with a large number of free services for efficient trading.


