 Maradok
Kereskedési feltételek
Products
Eszkozok


The EUR/USD currency pair slightly corrected during Friday's trading, but the growth of the European currency is too weak to make long-term conclusions. Overall, the euro continues to decline amid the presumed tightening of the Federal Reserve's monetary policy stance. However, this is a common opinion that we do not support. We believe that the reason lies in speculative-technical factors. Simply put, a downward trend has formed in the medium term, which traders and large players are exploiting based on its presence. We do not consider the potential increase in the Fed's rates as a basis for a week-and-a-half-long US currency rally. Moreover, the European Central Bank has already raised interest rates, yet the market has ignored this. Recent economic data from across the ocean has been relatively positive, including the job market and the state of the economy. However, it should be noted that the key reason the dollar showed growth in 2026—geopolitics—has been mitigated at least for some time.
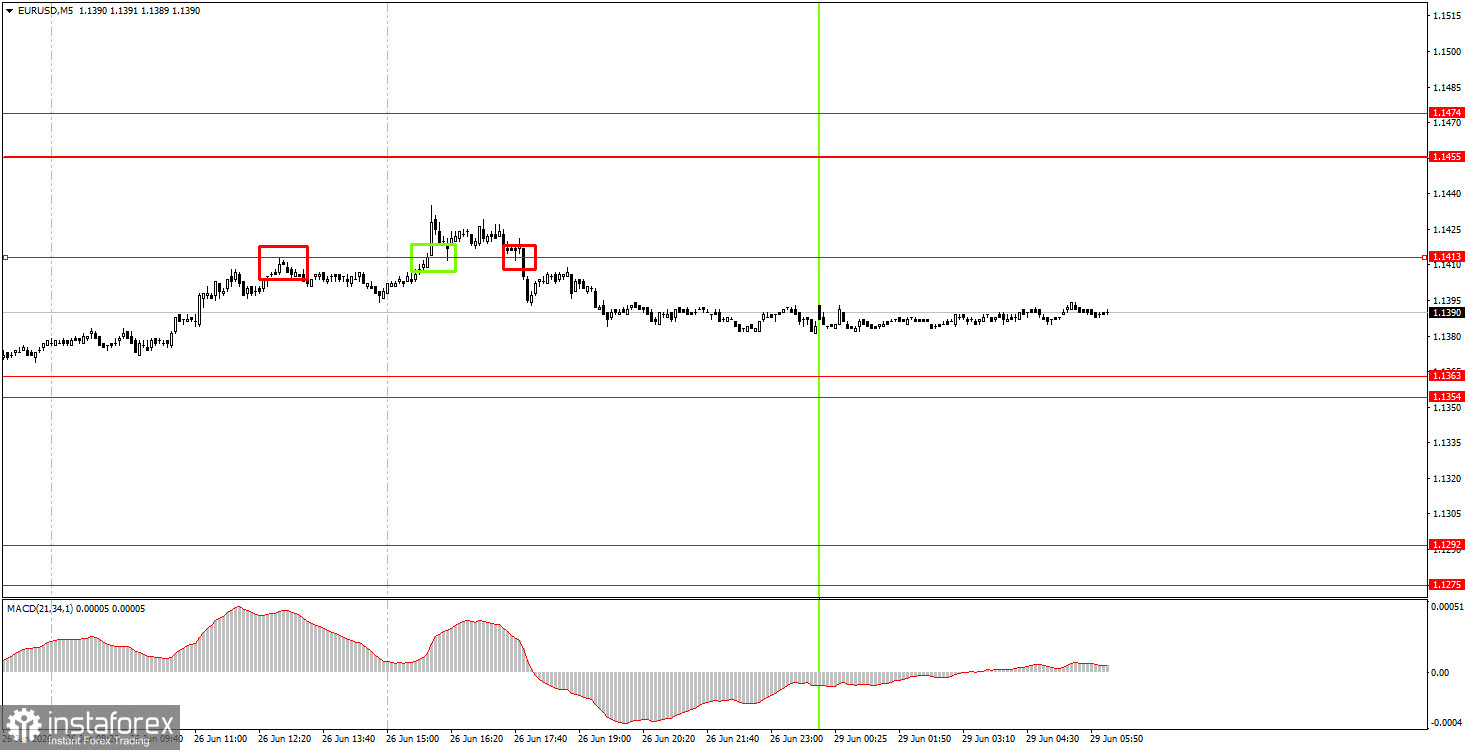
On the 5-minute timeframe, several trading signals were generated on Friday, but only the first one warranted attention. Just before the European trading session opened, the price bounced off the 1.1354-1.1363 range, allowing novice traders to open long positions. The level of 1.1413 was processed, forming a sell signal that proved false, as did the subsequent buy signal. Thus, the last two trades were unprofitable, but the first was profitable.
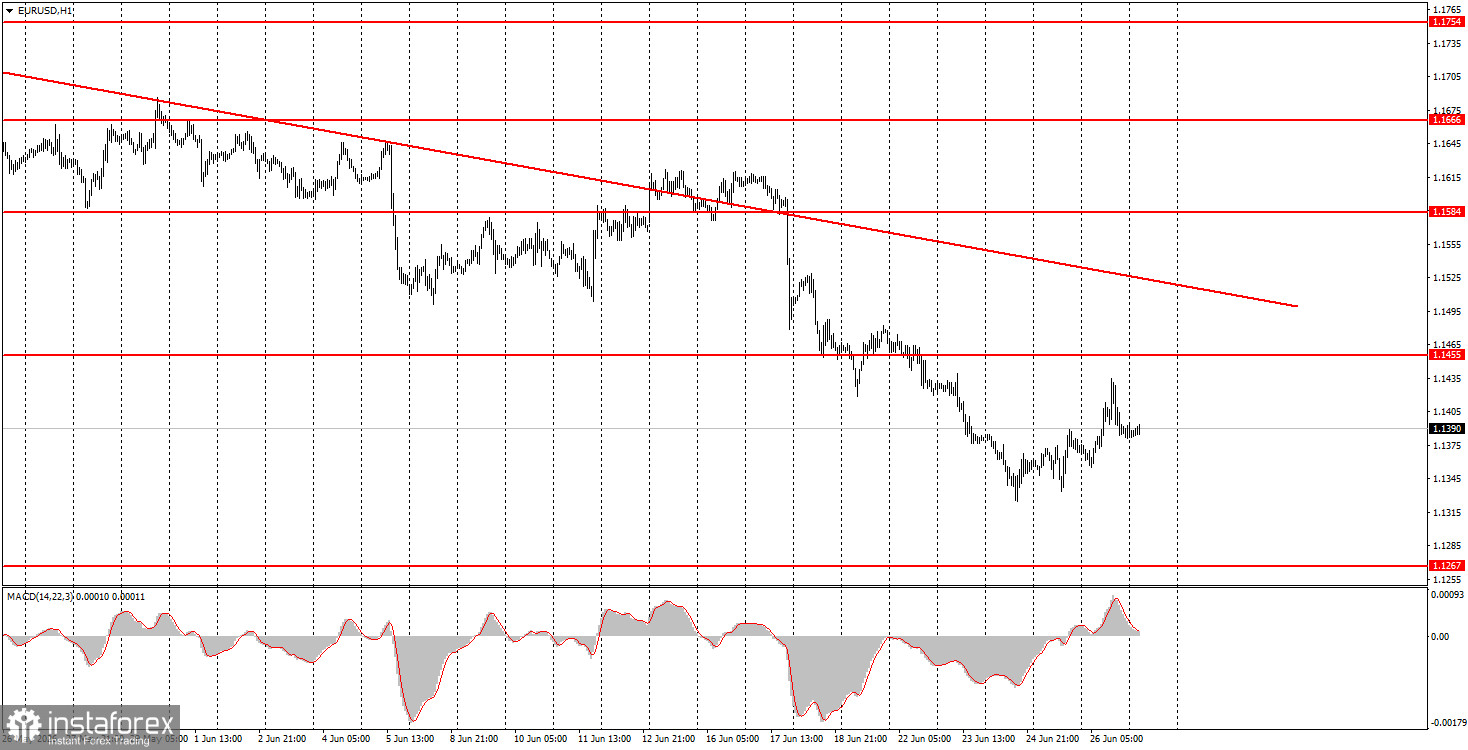
On the hourly timeframe, the downward trend continues despite the breakout of the trend line. Since the deal between Iran and the US has been signed, the market has one less reason to buy the US dollar. However, the market pays no attention to this fact and generally ignores almost all other factors in favor of the euro. Therefore, the current strengthening of the US dollar lacks clear and understandable reasons.
On Monday, novice traders may open short positions with targets of 1.1275-1.1292 if the price settles below the 1.1354-1.1363 range. Long positions can be opened targeting 1.1413 if the price bounces off the 1.1354-1.1363 range. Volatility may again be low, which should be taken into account.
On the 5-minute timeframe, important levels to consider are 1.1292, 1.1354-1.1363, 1.1455-1.1474, 1.1527-1.1531, 1.1584-1.1594, 1.1655-1.1666, 1.1745-1.1754, and 1.1830-1.1837. On Monday, the only significant event we can note is the speech by ECB President Christine Lagarde; however, we remind you that the ECB has already begun a cycle of policy tightening, to which the market has not responded. Therefore, there will likely be no reaction to Lagarde's speech.
Price levels (areas) of support and resistance are targets when opening long or short positions or sources of signals.
Red lines indicate channels or trend lines that display the current trend and indicate the preferred direction for trading.
The MACD indicator (14,22,3) – histogram and signal line – is a supplementary indicator that can also be used as a source of signals.
Important speeches and reports (contained in the news calendar) can significantly impact the movement of the currency pair. Therefore, during their release, trading should be conducted with maximum caution, or one should exit the market to avoid sharp reversals against preceding movements.
Beginners trading in the forex market should remember that not every trade can be profitable. Developing a clear strategy and practicing money management are key to long-term success in trading.
InstaForex analytical reviews will make you fully aware of market trends! Being an InstaForex client, you are provided with a large number of free services for efficient trading.


