 Maradok
Kereskedési feltételek
Products
Eszkozok


The GBP/USD pair continued its weak upward correction on Tuesday, driven solely by technical factors. The British pound has been in decline for approximately two months; however, it cannot be said that the global upward trend has ended. On higher timeframes, it is clear that the pair has been moving sideways more than up or down over the past year, and in a longer-term perspective, it has been rising for four years. Thus, in our view, long-term prospects remain bullish. The British pound is unlikely to show growth in 2026 if not for the war in the Middle East. It is impossible to predict how many more "black swans" will arise during Donald Trump's presidency. Therefore, while the US dollar is currently strong, it is unpredictable what will happen in a month. The macroeconomic backdrop continues to be largely ignored; the market selectively prices in reports and events.
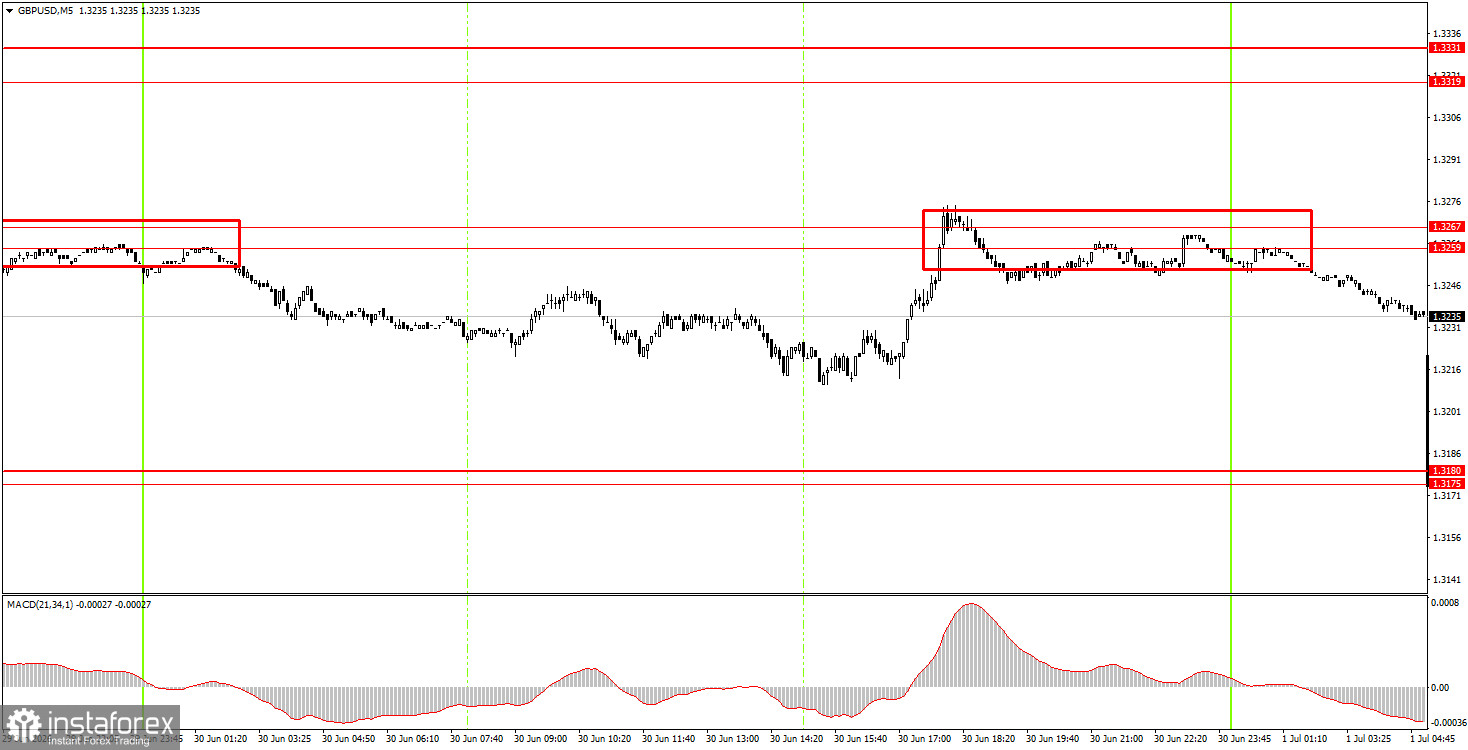
In the 5-minute timeframe on Tuesday, two sell signals were formed. During the Asian trading session, the price bounced off the 1.3259-1.3267 range, triggering a 35-pip decline. During the American session, the price bounced off the same range of 1.3259-1.3267 for the second time, which provoked another slight decline. Volatility is currently low, and whether this week's macroeconomic data will raise it remains a big question.
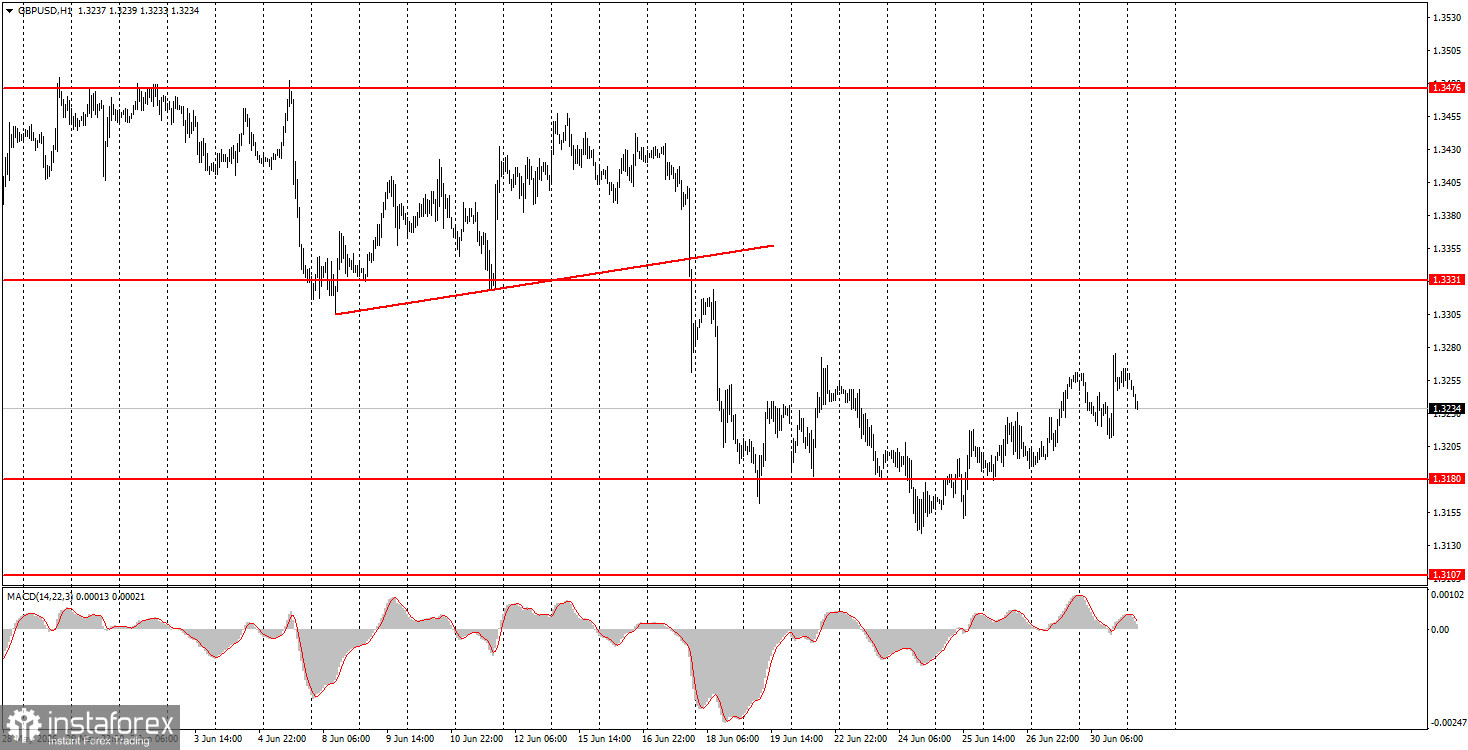
On the hourly timeframe, the GBP/USD pair continues its downward trend. The conflict in the Middle East, if not completely resolved, is on pause; the Federal Reserve has only indicated a possible rate hike by the end of the year, which may or may not happen, and the market has not been particularly upset by Keir Starmer's resignation. Thus, we do not see sufficient reasons for the dollar's growth in recent weeks, nor for its continuation.
On Wednesday, novice traders may consider staying in short positions targeting 1.3175-1.3180 after a bounce from the area of 1.3259-1.3267. A price consolidation above the 1.3259-1.3267 range will allow for long positions targeting 1.3319-1.3331.
On the 5-minute timeframe, the following levels can currently be traded: 1.3043, 1.3096-1.3107, 1.3175-1.3180, 1.3259-1.3267, 1.3319-1.3331, 1.3380-1.3386, 1.3456-1.3476, 1.3587-1.3598, 1.3631-1.3641, and 1.3695. On Wednesday, Bank of England Governor Andrew Bailey is scheduled to deliver a speech, and in the US, the ADP and ISM reports will be released, along with a speech from Fed Chair Kevin Warsh.
Price levels (areas) of support and resistance are targets when opening long or short positions or sources of signals.
Red lines indicate channels or trend lines that display the current trend and indicate the preferred direction for trading.
The MACD indicator (14,22,3) – histogram and signal line – is a supplementary indicator that can also be used as a source of signals.
Important speeches and reports (contained in the news calendar) can significantly impact the movement of the currency pair. Therefore, during their release, trading should be conducted with maximum caution, or one should exit the market to avoid sharp reversals against preceding movements.
Beginners trading in the forex market should remember that not every trade can be profitable. Developing a clear strategy and practicing money management are key to long-term success in trading.
InstaForex analytical reviews will make you fully aware of market trends! Being an InstaForex client, you are provided with a large number of free services for efficient trading.


