 Maradok

Kereskedési feltételek
Products
Eszkozok


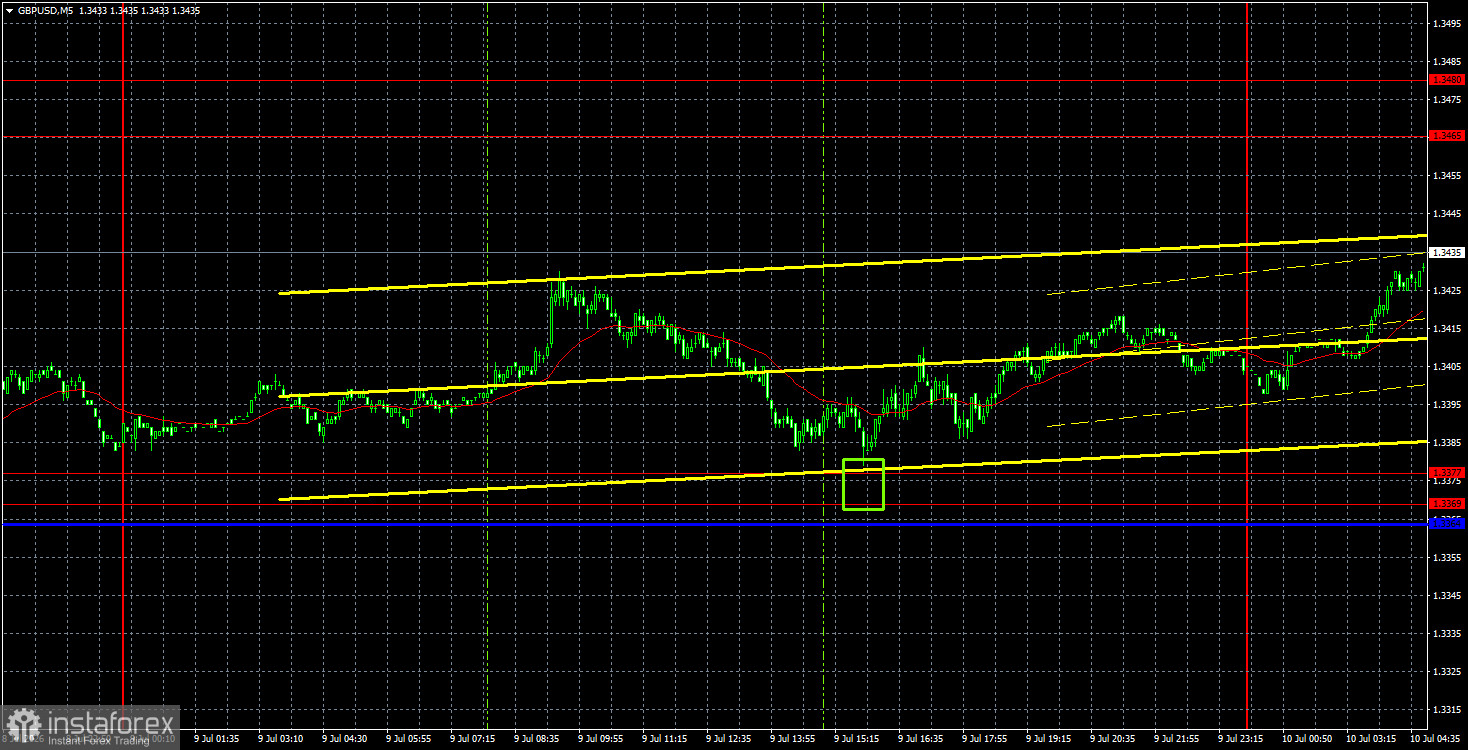
The GBP/USD currency pair continued its upward movement on Thursday without any local reasons or foundations. The British currency has been rising for two and a half weeks now, and all experts are silently observing this movement, not even attempting to explain it. Why is the pound sterling rising this week, given that there have been no news, important events, or significant speeches? If the Fed is taking a hawkish stance compared to the Bank of England, and the UK is engulfed in yet another political crisis, it begs the question.
The last round of declines in the British pound was driven by inertia, technical factors, and speculation. Market makers deliberately pushed the British pound down as far as possible to buy it at more favorable prices—a typical manipulation. Therefore, we always say in our articles: not all market movements are logical or justifiable. The ability to spot illogical movements is a plus for any trader, as it helps understand that the price should move in the opposite direction. If that movement does not occur, it means speculation and manipulation have begun.
On the weekly timeframe, the pound remains in a flat channel, and after falling to its lower region, a movement toward the upper boundary is expected, which we are currently observing.
From a technical standpoint, the British pound remains within an upward trend, clearly indicated by the trend line. The 1.3369-1.3377 area has been breached, allowing the British currency to continue its advance. This week, there have been very few important events, so traders have been trading based on technical analysis, which is exactly what they are doing. We believe that the upward movement, at least within the lateral channel on the daily timeframe, should continue.
On the 5-minute timeframe on Thursday, one buy signal was formed, providing traders with excellent profit. At the start of the American trading session, the price bounced off the 1.3369-1.3377 area with minimal deviation, allowing traders to open longs. By Friday morning, the British currency's exchange rate had risen by 50 pips.
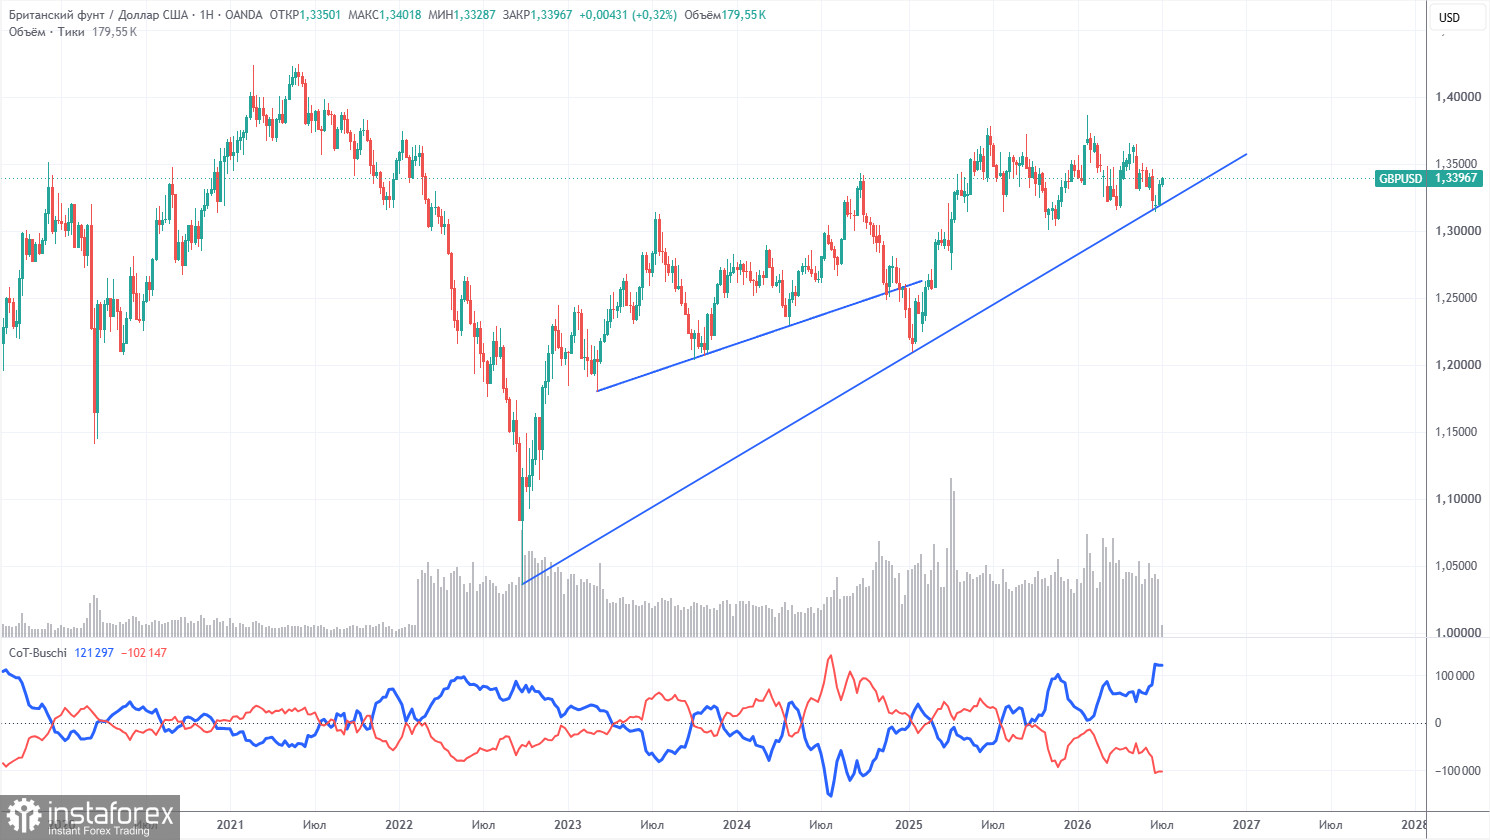
COT reports on the British pound show that commercial traders' sentiment has fluctuated in recent years. The red and blue lines, which reflect the net positions of commercial and non-commercial traders, consistently cross and often near the zero mark. Currently, the lines are diverging, with non-commercial traders continuing to dominate with... sales. Given events in the Middle East, it is not surprising that demand for risk currencies has been weak in 2026. However, with the war over, there is no longer a reason to buy the dollar, and the pound sterling has not significantly declined in the long term, despite low demand from professional players.
In the long term, the dollar will continue to decline due to Donald Trump's policies, which is clearly visible on the weekly timeframe (illustration above). The trade war will continue in one form or another for a long time, and Trump's policy is aimed, both directly and indirectly, at weakening the US currency. The long-term upward trend remains, as indicated by the trend line. Just last week, the price interacted with this line and bounced off it. According to the latest COT report (dated June 30), the "Non-commercial" group closed 3,600 BUY contracts and 7,200 SELL contracts. Thus, the net position of non-commercial traders decreased by another 3,600 contracts over the week.
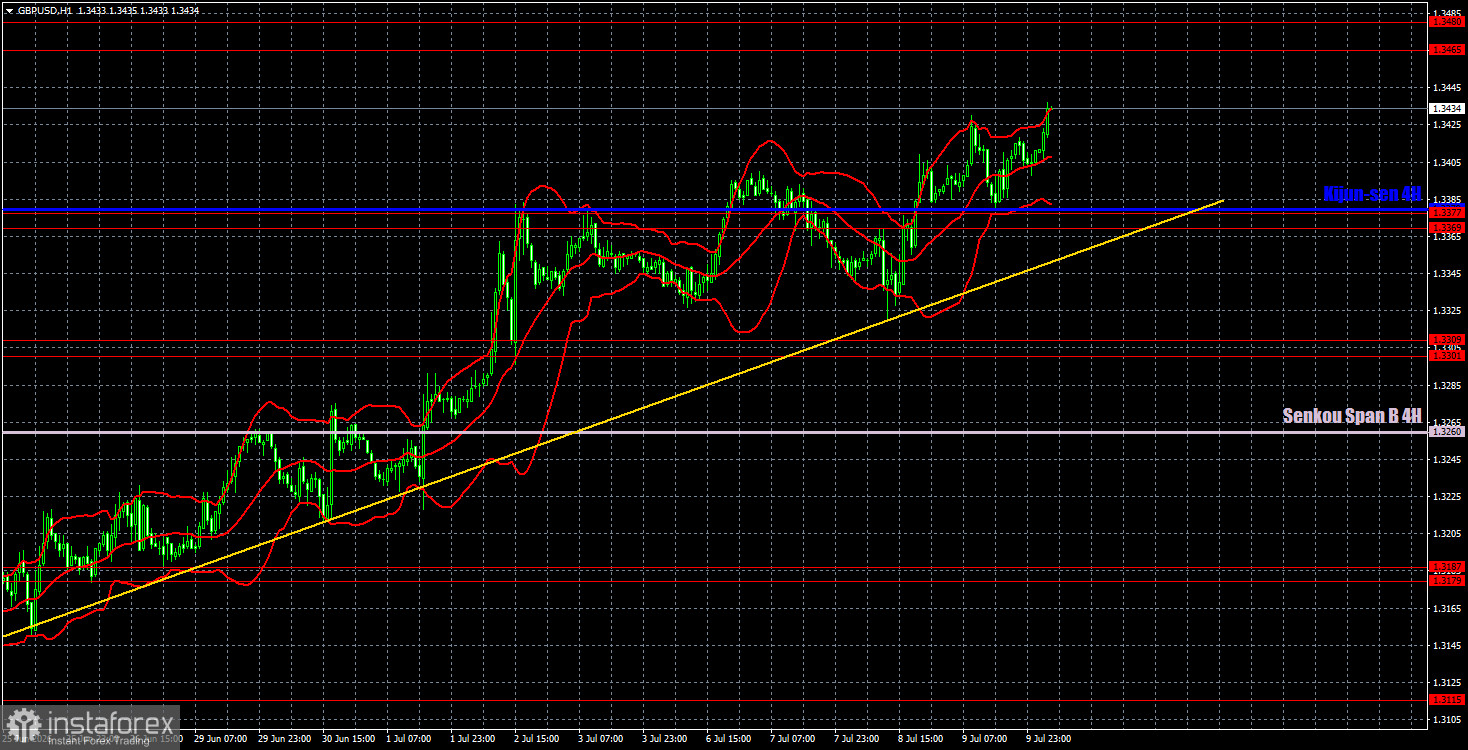
On the hourly timeframe, the GBP/USD pair continues to form an upward trend. In the long term, the pound sterling still has no valid reasons to decline, while the US dollar has none to grow. The market has recently ignored most fundamental, geopolitical, and macroeconomic events, and the pair has begun moving from the lower boundary of the lateral channel to the upper boundary. Therefore, we still expect upward movement.
For July 10, we highlight the following important levels for trading: 1.3042-1.3050, 1.3096-1.3115, 1.3179-1.3187, 1.3301-1.3309, 1.3369-1.3377, 1.3465-1.3480, 1.3588, 1.3671-1.3681. The Senkou Span B line (1.3260) and Kijun-sen line (1.3379) may also serve as sources of signals. It is recommended to set the Stop Loss order to break even if the price moves in the correct direction by 20 pips. The Ichimoku indicator lines may move during the day, which should be taken into account when determining trading signals.
On Friday, there are no significant events or reports scheduled in the UK, and the calendar in the US is also empty. Thus, movements today will again be technical.
Today, traders may open short positions targeting the area of 1.3369-1.3377 if the pair bounces from the area of 1.3465-1.3480. New long positions can be opened in the case of breaching the area of 1.3465-1.3480, targeting 1.3588.
InstaForex analytical reviews will make you fully aware of market trends! Being an InstaForex client, you are provided with a large number of free services for efficient trading.


