 Maradok
Kereskedési feltételek
Products
Eszkozok



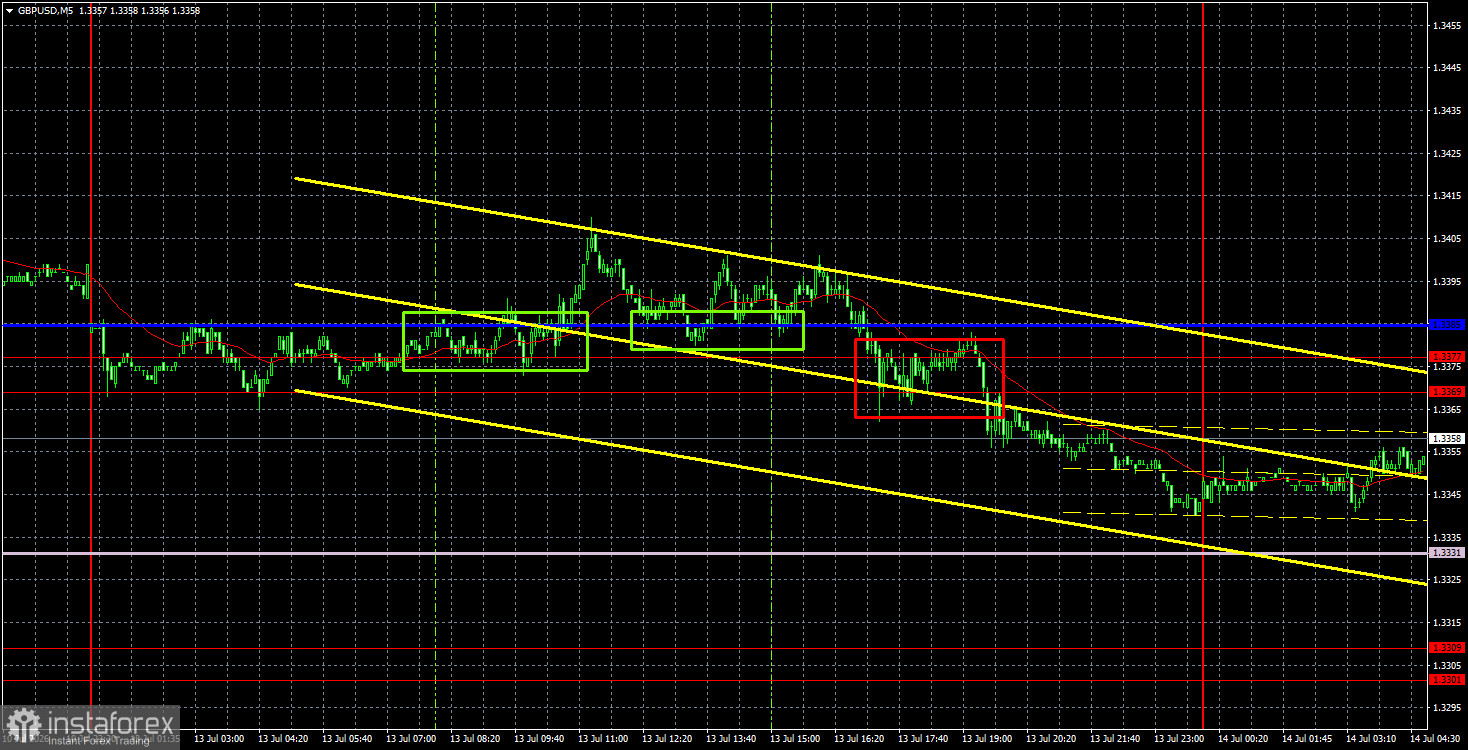
The GBP/USD currency pair traded lower on Monday and generally remains a pair that is moving rather than stagnant. The U.S. dollar gained market support on Monday as geopolitics once again drove traders to seek refuge. Of course, there is no longer a large-scale flight of capital from the Middle East since all investors who wanted to flee have likely already done so. However, it cannot be denied that the situation around the Strait of Hormuz is worsening again, and Tehran and Washington are unable to agree even on a new meeting for negotiations, let alone anything more significant. Thus, it appears that the conflict will continue and persist for a long time. Oil has been rising for several consecutive days and has already reached $85 per barrel. It is likely to continue its upward trajectory. As for the British pound, it has performed quite well in recent weeks, but now the time has come for a correction.
From a technical perspective, the British pound is positioned for a near-term decline. The ascending trend line has been breached, and the price is now supported only by the Senkou Span B line. If that line is breached as well, the decline of the British currency will continue. However, in the medium term, we still expect growth within a sideways channel on higher timeframes.
On the 5-minute timeframe, a few trading signals were generated on Monday, but each left much to be desired due to weak volatility. In the first half of the day, the price bounced twice from the 1.3369-1.3385 area but failed to advance. In the second half of the day, the pair consolidated below the 1.3369-1.3377 area, and by the end of the day, it had only declined by 10-15 pips. Market movements remain extremely weak, which is the main issue.
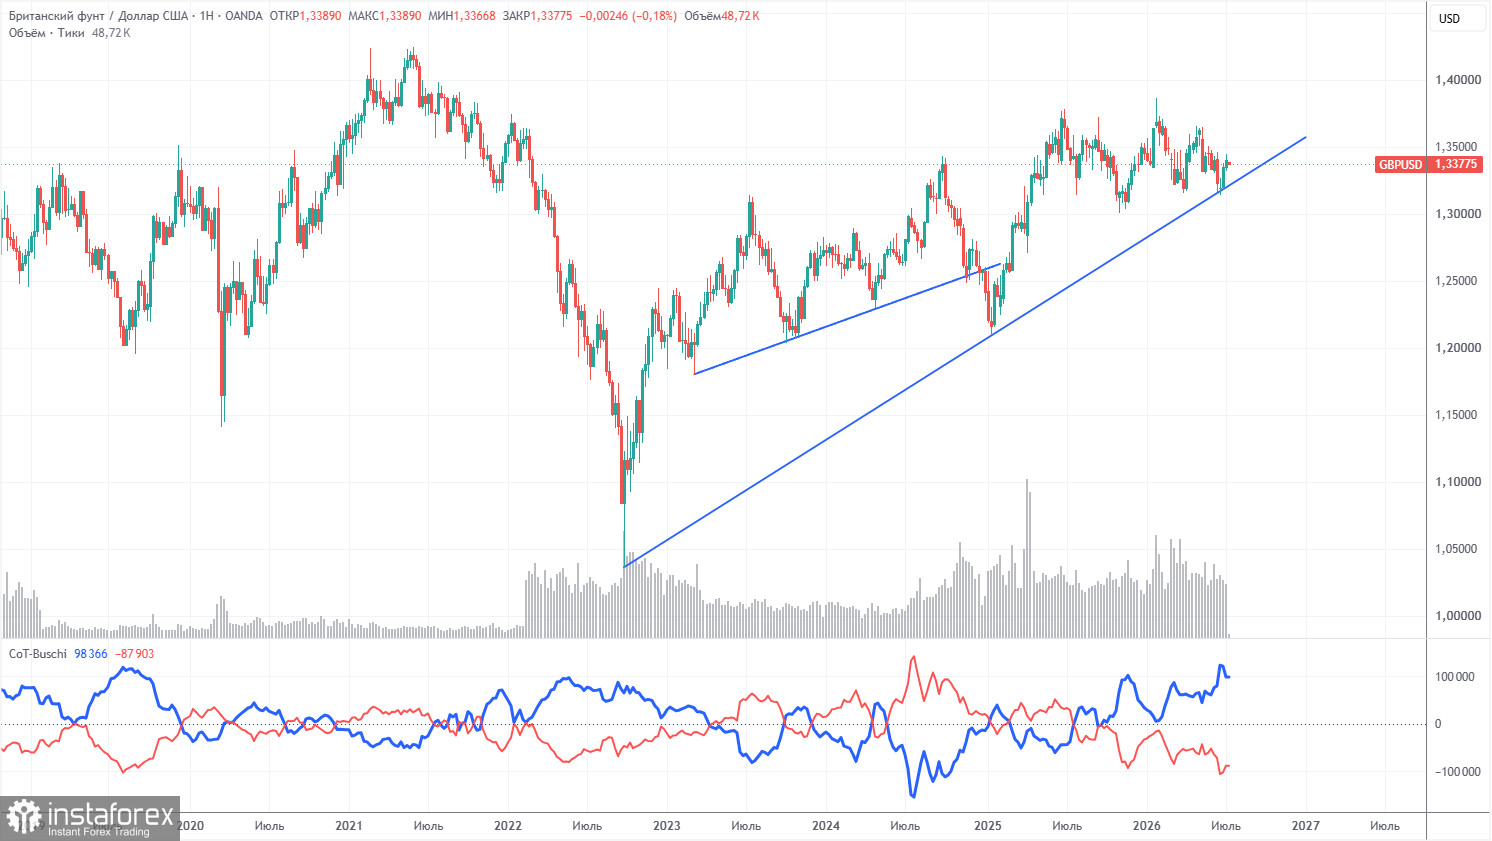
The COT reports for the British pound indicate that non-commercial traders have dominated the market with sales for several months. The net position is negative, despite the long-term upward trend being maintained. Given the events in the Middle East, it is not surprising that demand for risk currencies remains weak. The war is formally over, but the conflict persists. It is this geopolitics that may support demand for the U.S. dollar in the near term. However, we would not expect a significant decline in the pair unless it consolidates below the trend line.
In the long term, the dollar will continue to decline due to Donald Trump's policies, as is clearly visible on the weekly timeframe (illustration above). The trade war will continue in one form or another for a long time, and Trump's policies aim to weaken the American currency both directly and indirectly. The long-term upward trend remains, as evidenced by the trend line. The price recently interacted with this line and bounced off it. According to the latest COT report (dated July 7), the "Non-commercial" group opened 7,400 BUY contracts and closed 6,800 SELL contracts. Thus, the net position for non-commercial traders increased by 14,200 contracts over the week, which does not significantly affect the overall sentiment of professional players.
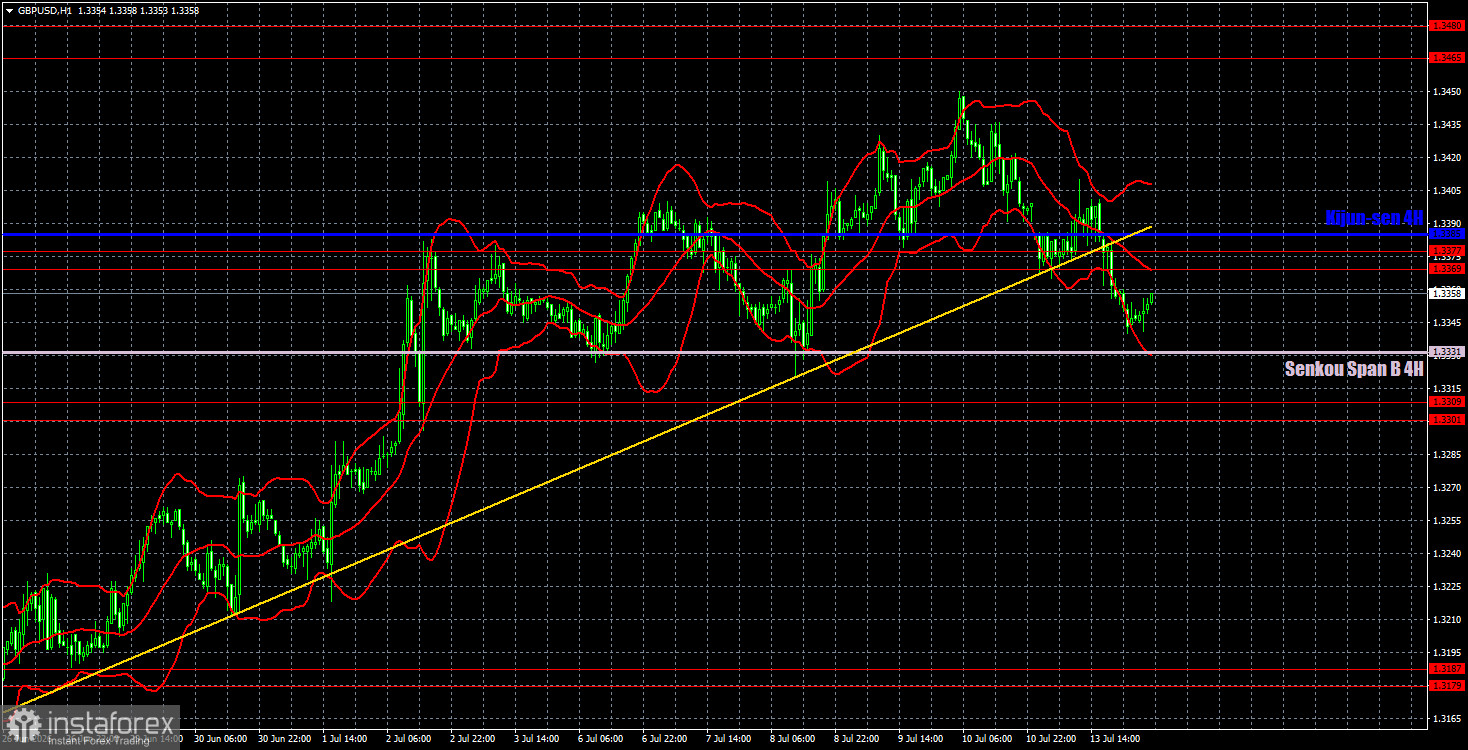
On the hourly timeframe, the GBP/USD pair may begin a new downward trend or at least a correction. The market has recently ignored most fundamental, geopolitical, and macroeconomic events, while on the daily timeframe the pair has begun moving from the lower boundary of the sideways channel toward the upper boundary. Therefore, in the medium term, we still expect upward movement. However, in the near term, support for the dollar may come from geopolitics and related factors.
For July 14, we highlight the following important levels: 1.3042-1.3050, 1.3096-1.3115, 1.3179-1.3187, 1.3301-1.3309, 1.3369-1.3377, 1.3465-1.3480, 1.3588, 1.3671-1.3681. The Senkou Span B line (1.3331) and Kijun-sen (1.3385) may also serve as sources for signals. It is recommended to set stop-loss orders to breakeven if the price moves in the correct direction by 20 pips. The lines of the Ichimoku indicator may shift during the day, which should be taken into account when determining trading signals.
On Tuesday, the Bank of England Chair Andrew Bailey is scheduled to speak, and in the U.S., inflation data will be published along with a speech in Congress by Federal Reserve Chair Kevin Warsh. All three events are significant, especially the inflation report, which will determine the future actions of the American central bank.
Today, traders may consider short positions targeting the Senkou Span B line if the pair bounces from the 1.3369-1.3377 area from below or breaks through the Senkou Span B line. Long positions can be opened in case of a bounce from the Senkou Span B line with targets in the area of 1.3369-1.3385.
InstaForex analytical reviews will make you fully aware of market trends! Being an InstaForex client, you are provided with a large number of free services for efficient trading.


