 Maradok

Kereskedési feltételek
Products
Eszkozok


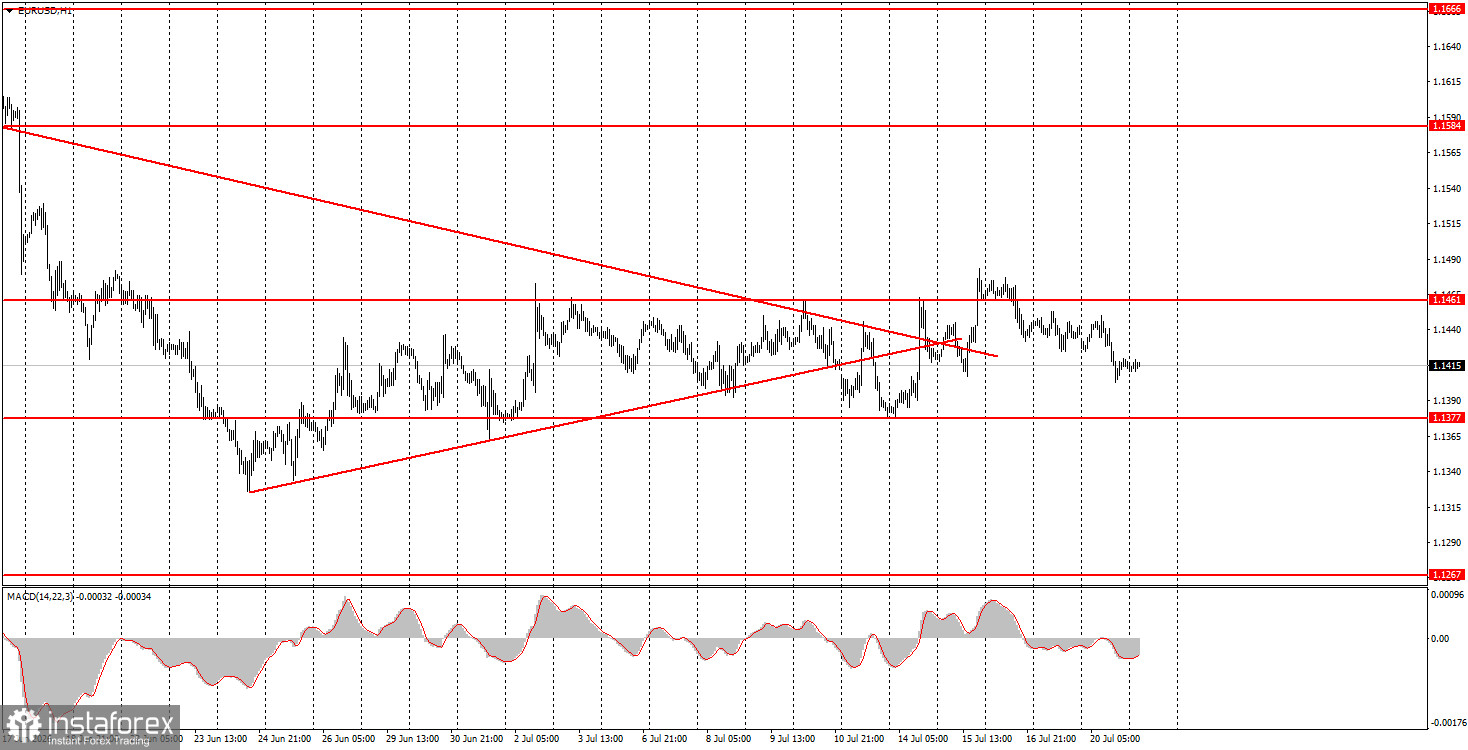
The EUR/USD currency pair once again showed no interesting movements during trading on Monday. Throughout the day, there was no interesting economic information available to traders. Moreover, the market has mostly ignored geopolitical news. Of course, if information about the blockade of the Bab-el-Mandeb Strait is confirmed, the dollar could begin to rise again. However, from our perspective, regardless of how events unfold in the Middle East, the dollar can no longer expect strong growth based on this factor. The market cannot perpetually react only to geopolitics. In 2026, this is the primary support factor for the American currency. The hourly timeframe clearly shows that a flat pattern persists, and the volatility of the pair remains low. Thus, from a technical standpoint, nothing is changing. Volatility remains low. This week, the European Central Bank meeting will take place, but the ECB is not expected to make any important decisions.
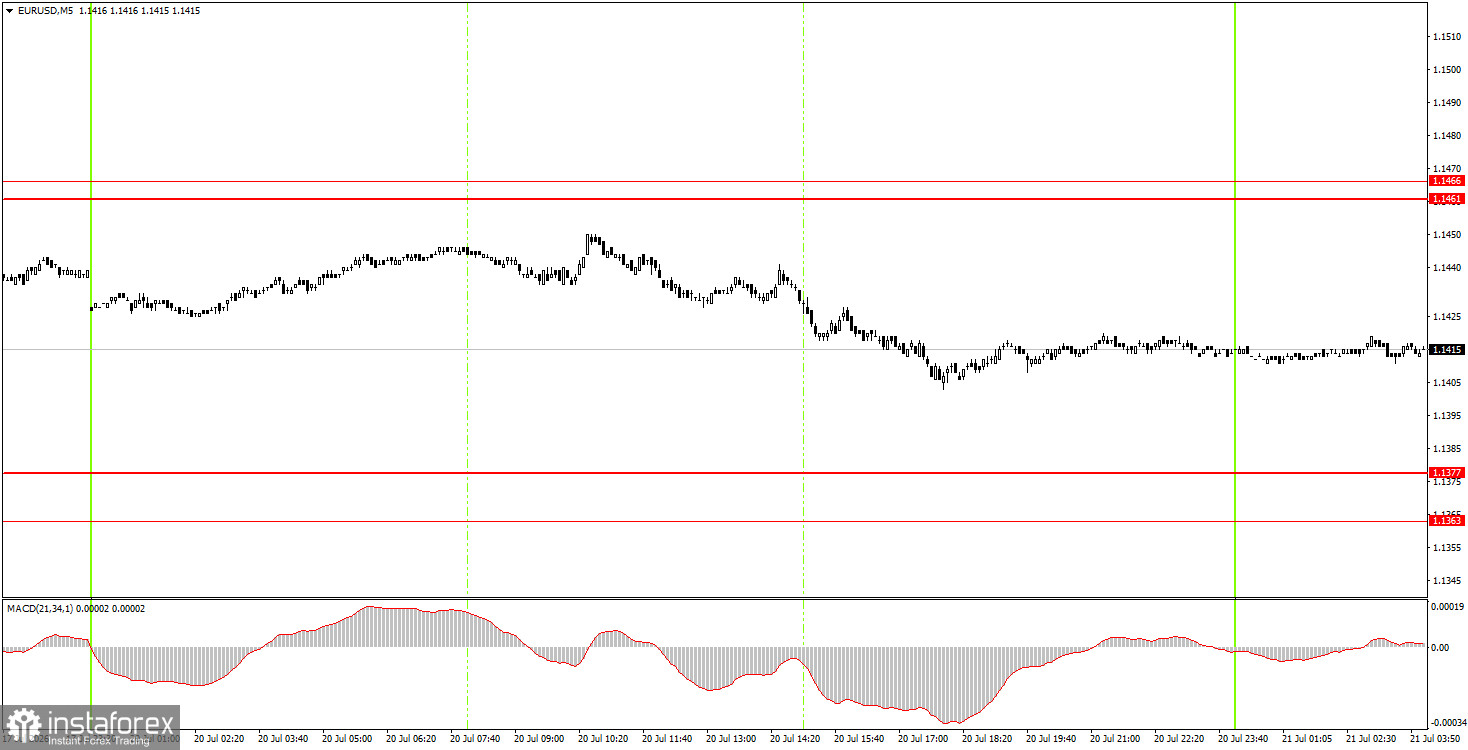
On the 5-minute timeframe, no trading signals were formed on Monday. Movements were once again weak, and the price was unable to test any levels or areas. Thus, there were again no grounds for novice traders to enter the market.
On the hourly timeframe, both trend lines have been broken and are no longer relevant. Taking into account all events and market movements in recent months, we believe that the European currency should show confident growth—much stronger than in recent weeks. However, in reality, all current upward movement is a correction, and in recent weeks, the movement resembles a flat much more than a trend.
On Tuesday, novice traders can open short positions with a target of 1.1363-1.1377 if the price bounces from the area of 1.1461-1.1466. Long positions can be opened with a target of 1.1461-1.1466 if the price bounces from the area of 1.1363-1.1377. We would still not expect strong movements.
On the 5-minute timeframe, the following levels should be considered: 1.1267-1.1275, 1.1363-1.1377, 1.1461-1.1466, 1.1527-1.1531, 1.1584-1.1594, 1.1655-1.1666, 1.1745-1.1754. On Tuesday, economic sentiment indices from ZEW will be published in the EU and Germany, along with the weekly ADP employment report in the U.S. We consider these reports to be secondary, so volatility may again remain low today.
Price levels (areas) of support and resistance are targets when opening long or short positions or sources of signals.
Red lines indicate channels or trend lines that display the current trend and indicate the preferred direction for trading.
The MACD indicator (14,22,3) – histogram and signal line – is a supplementary indicator that can also be used as a source of signals.
Important speeches and reports (contained in the news calendar) can significantly impact the movement of the currency pair. Therefore, during their release, trading should be conducted with maximum caution, or one should exit the market to avoid sharp reversals against preceding movements.
Beginners trading in the forex market should remember that not every trade can be profitable. Developing a clear strategy and practicing money management are key to long-term success in trading.
InstaForex analytical reviews will make you fully aware of market trends! Being an InstaForex client, you are provided with a large number of free services for efficient trading.


