 Maradok
Kereskedési feltételek
Products
Eszkozok



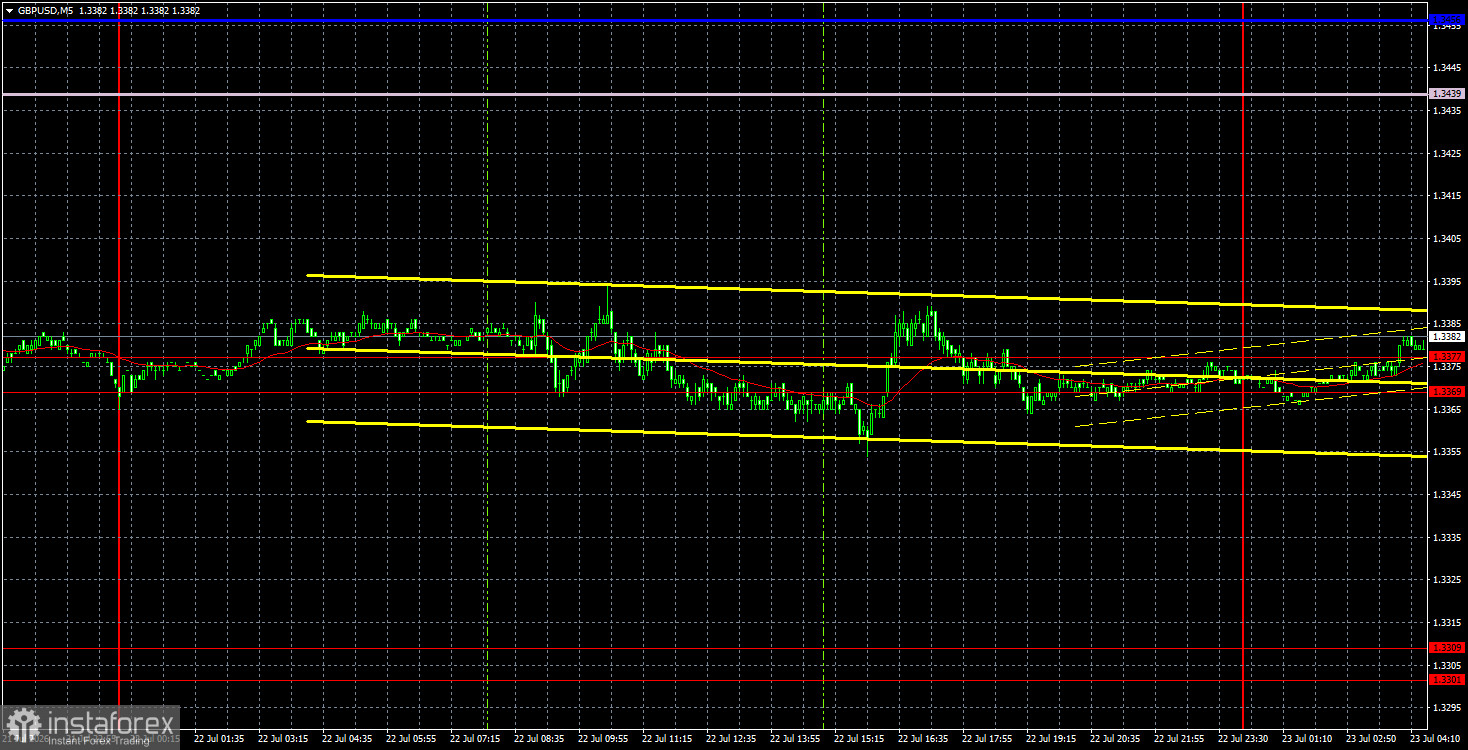
The GBP/USD currency pair did not show any interesting movements on Wednesday, moving only sideways throughout the day with minimal volatility. Recall that over the last week, the British pound has experienced a significant decline, which we consider a correction against the preceding three-week growth. However, it was yesterday, when the British currency stood still, that the most important report for the pound sterling—on inflation—was published. The Consumer Price Index (CPI) in the UK slowed to 2.6% in June, which is below forecasts. The lower the inflation, the greater the chances for the Bank of England to resume easing its monetary policy, which is naturally bad for the pound sterling. Yet yesterday, the pound did not show any decline or any movements at all. It could be one of two things: either the market priced this report in advance (insider information), or the market is continuing to trade by its own rules, ignoring macroeconomic and fundamental factors. We believe that both factors played a role.
From a technical perspective, the British pound continues to display a downward trend on the hourly timeframe, which is likely a correction against the upward trend on the 4-hour timeframe. The trend line supports the bears, but a consolidation above it will indicate a trend reversal. Additionally, the price is situated below the lines of the Ichimoku indicator, which also indicates a downward trend.
On the 5-minute timeframe on Wednesday, the price ignored everything. The 1.3369-1.3377 area was disregarded five times throughout the day. No good trading signals were generated. The pair moved sideways with minimal volatility throughout the day, and the market also ignored the most important inflation report.
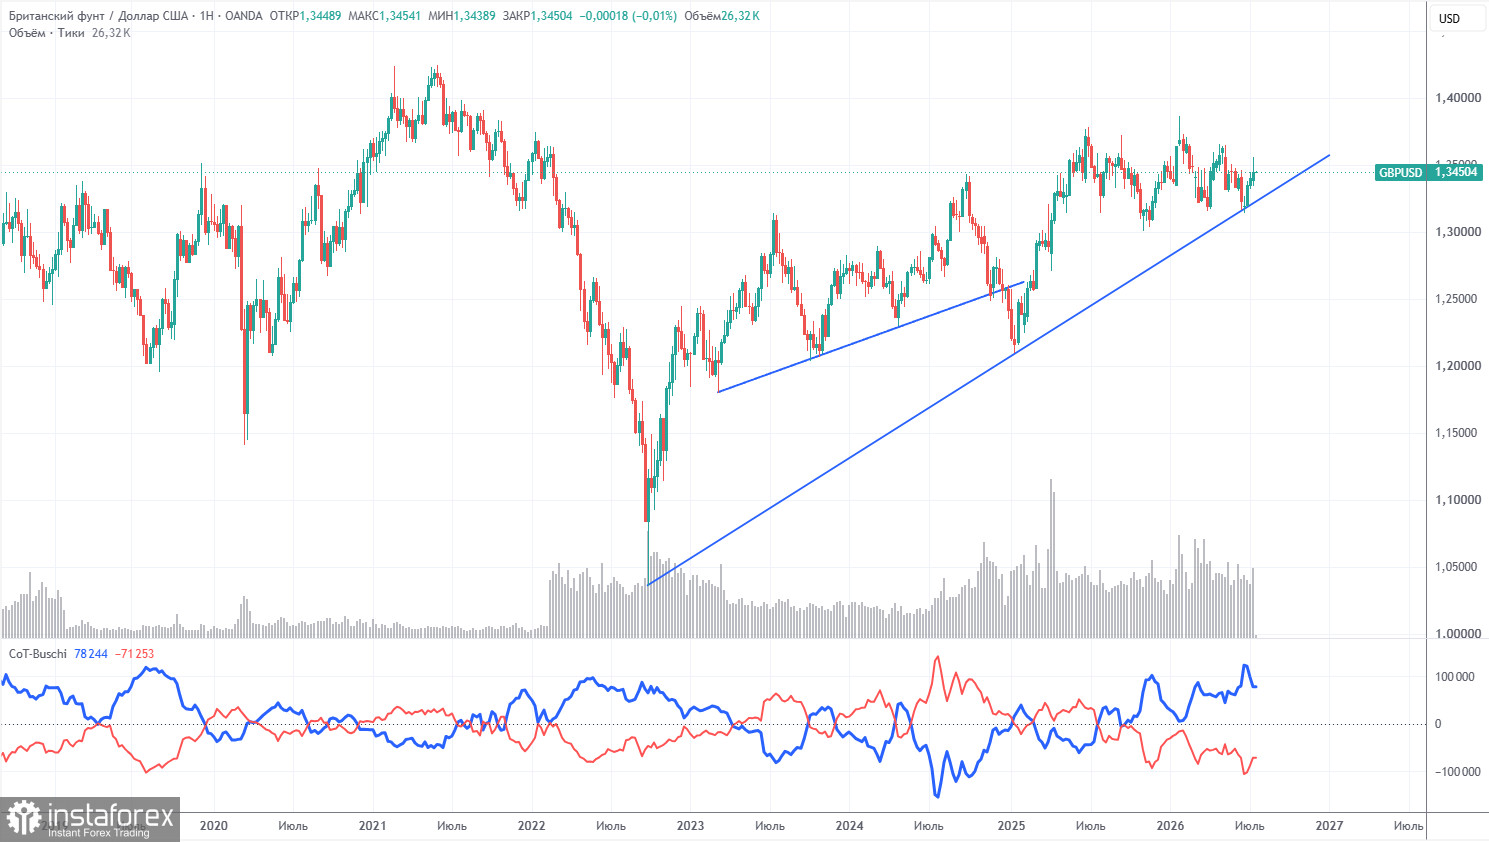
COT reports for the British pound show that non-commercial traders have dominated the market with sales for several consecutive months. The net position is negative, despite the long-term upward trend remaining in place. Considering events in the Middle East, it is not surprising that demand for risk currencies remains weak. The war is formally over, but the conflict persists. Geopolitics may support demand for the US dollar in the near future. However, we would not expect a strong decline in the pair until a consolidation below the trend line occurs.
In the long term, the dollar is expected to continue declining due to Donald Trump's policies, which is clearly visible on the weekly timeframe (see illustration above). The trade war will continue in one form or another for a long time, and Trump's policies are aimed directly and indirectly at weakening the US currency. The long-term upward trend remains, as evidenced by the trend line. The price recently tested this line and bounced off it. According to the latest COT report (dated July 14), the "Non-commercial" group opened 6,500 BUY contracts and closed 10,100 SELL contracts. Therefore, the net position of non-commercial traders increased by 16,600 contracts over the week, which does not influence the overall sentiment of professional players.
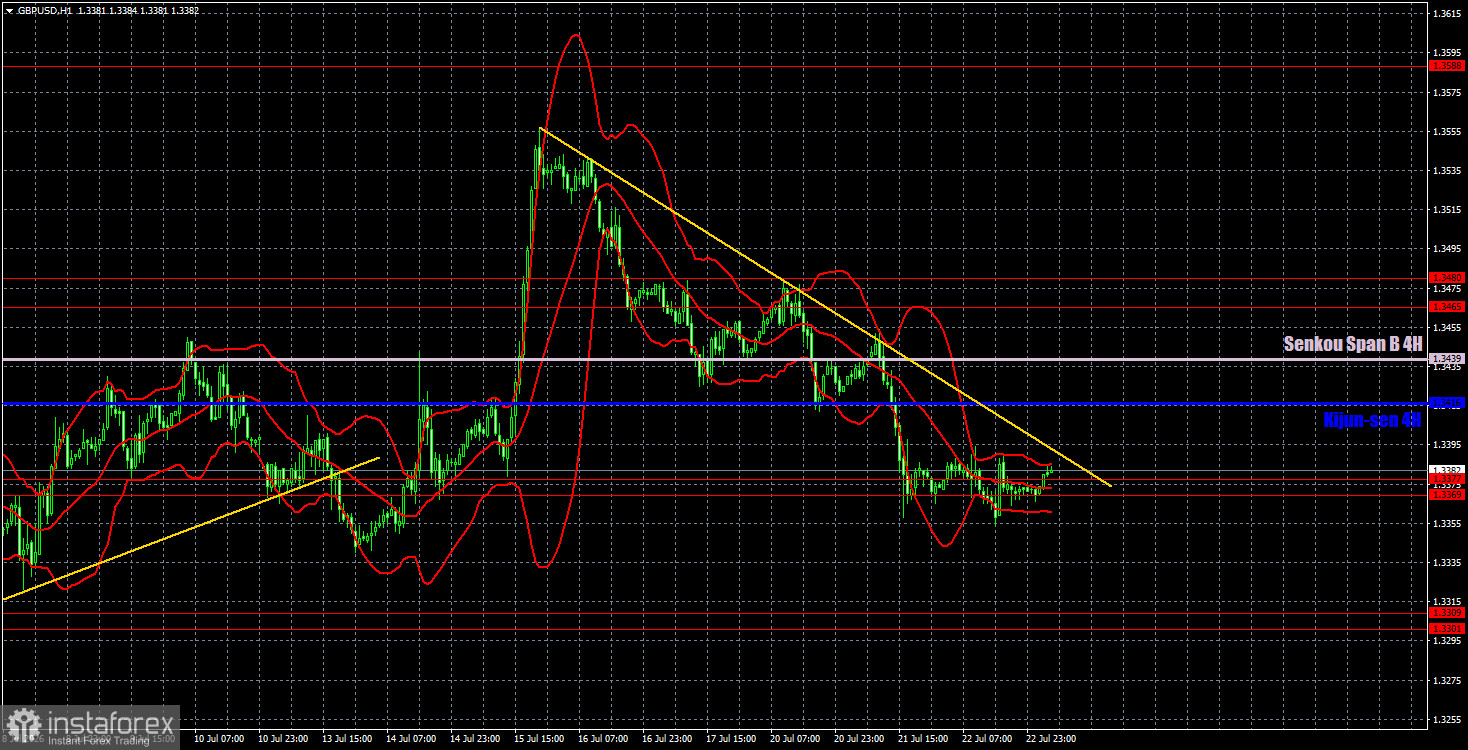
On the hourly timeframe, the GBP/USD pair continues to correct after three weeks of growth. The market continues to ignore geopolitical factors, and in recent weeks we have observed technical growth supported by weak US inflation data. After the current correction, it is quite possible to expect a resumption of growth for the British currency based on the pair's movements within the horizontal channel on the weekly timeframe.
For July 23, we highlight the following important levels: 1.3042-1.3050, 1.3096-1.3115, 1.3179-1.3187, 1.3301-1.3309, 1.3369-1.3377, 1.3465-1.3480, 1.3588, 1.3671-1.3681. The Senkou Span B (1.3439) and Kijun-sen (1.3416) lines may also serve as sources of signals. It is recommended to set the Stop Loss order to breakeven if the price moves in the right direction by 20 pips. The lines of the Ichimoku indicator may shift throughout the day, which should be considered when determining trading signals.
On Thursday, there are no significant events or publications scheduled in the UK or the US. The European Central Bank meeting will take place on this day, but how does that relate to the British pound? Most likely, we won't see interesting movements today, and the area of 1.3369-1.3377 is currently being ignored by traders. It is best to orient oneself based on the trend line and the lines of the Ichimoku indicator.
Today, traders may consider short positions targeting the area of 1.3301-1.3309 if the price consolidates below the area of 1.3369-1.3377. Long positions can be opened in the event of a bounce from the area of 1.3369-1.3377 with targets at the Senkou Span B and Kijun-sen lines. However, yesterday, the area of 1.3369-1.3377 was ignored throughout the day.
Support and resistance levels are represented by thick red lines, around which price movement may end. They are not sources of trading signals.
The Kijun-sen and Senkou Span B lines are Ichimoku indicator lines transferred to the hourly timeframe from the 4-hour timeframe. They are strong lines.
Extreme levels are represented by thin red lines from which the price has previously bounced. They are sources of trading signals.
Yellow lines are trend lines, trend channels, and any other technical patterns.
Indicator 1 on COT charts represents the size of the net position of each category of traders.
InstaForex analytical reviews will make you fully aware of market trends! Being an InstaForex client, you are provided with a large number of free services for efficient trading.


