 Maradok

Kereskedési feltételek
Products
Eszkozok


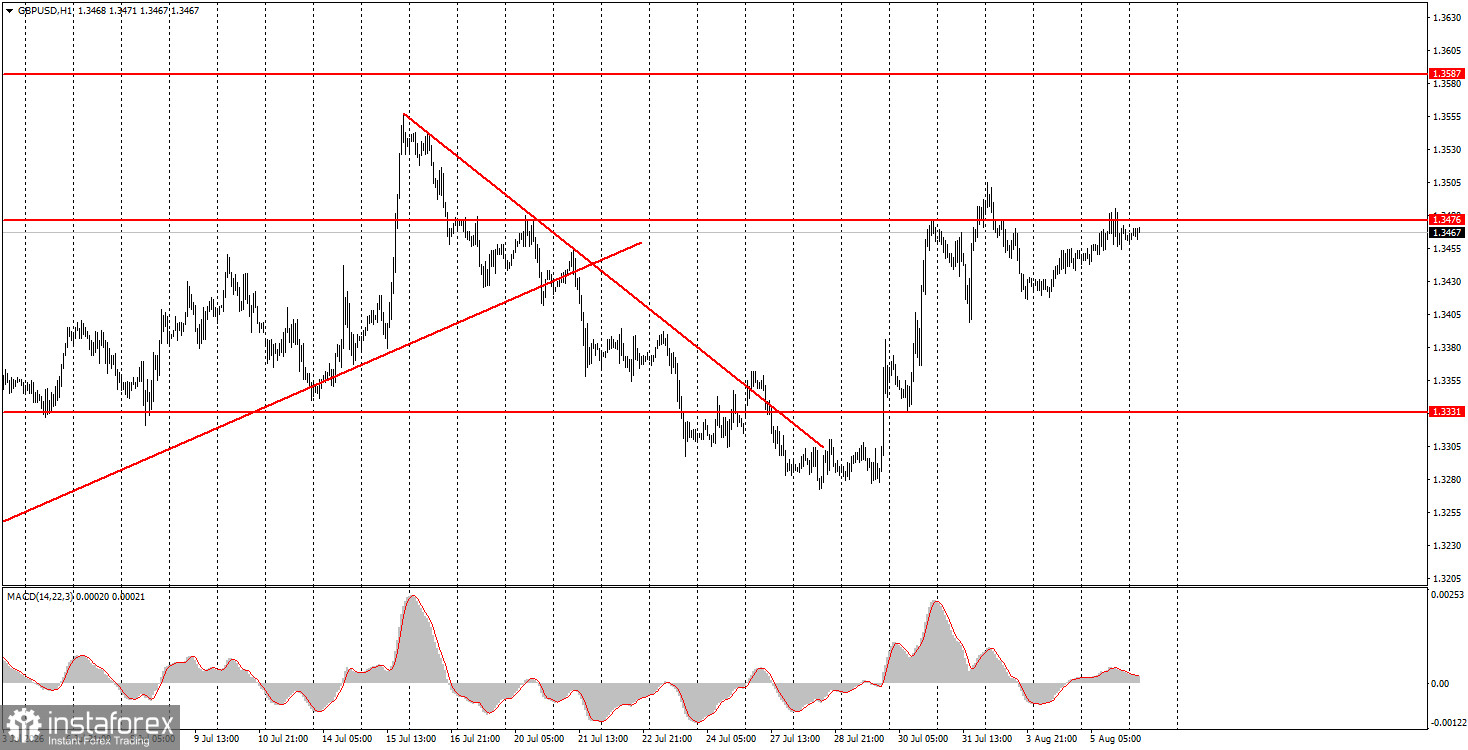
The GBP/USD pair also continued a modest upward move on Wednesday, driven by macroeconomic data from across the Atlantic, geopolitics, and technicals. Recall that once again the conflict in the Middle East is approaching its "conclusion," at least according to Donald Trump. Iran and Oman are reportedly close to an agreement on the Strait of Hormuz that would lift the blockade. How long this new opening will hold is hard to say, since key issues and disagreements between Iran and the U.S. remain unresolved. Nevertheless, the conflict is moving very slowly toward resolution—unfortunately so slowly that the movement is barely noticeable. Still, it is moving. Therefore, traders currently have no strong reason to rush into the dollar. U.S. macro data have not been great, and the Federal Reserve, as recent events show, is not eager to tighten monetary policy. If tomorrow's U.S. employment and unemployment reports are weak, the chances of a Fed rate hike will become practically zero.
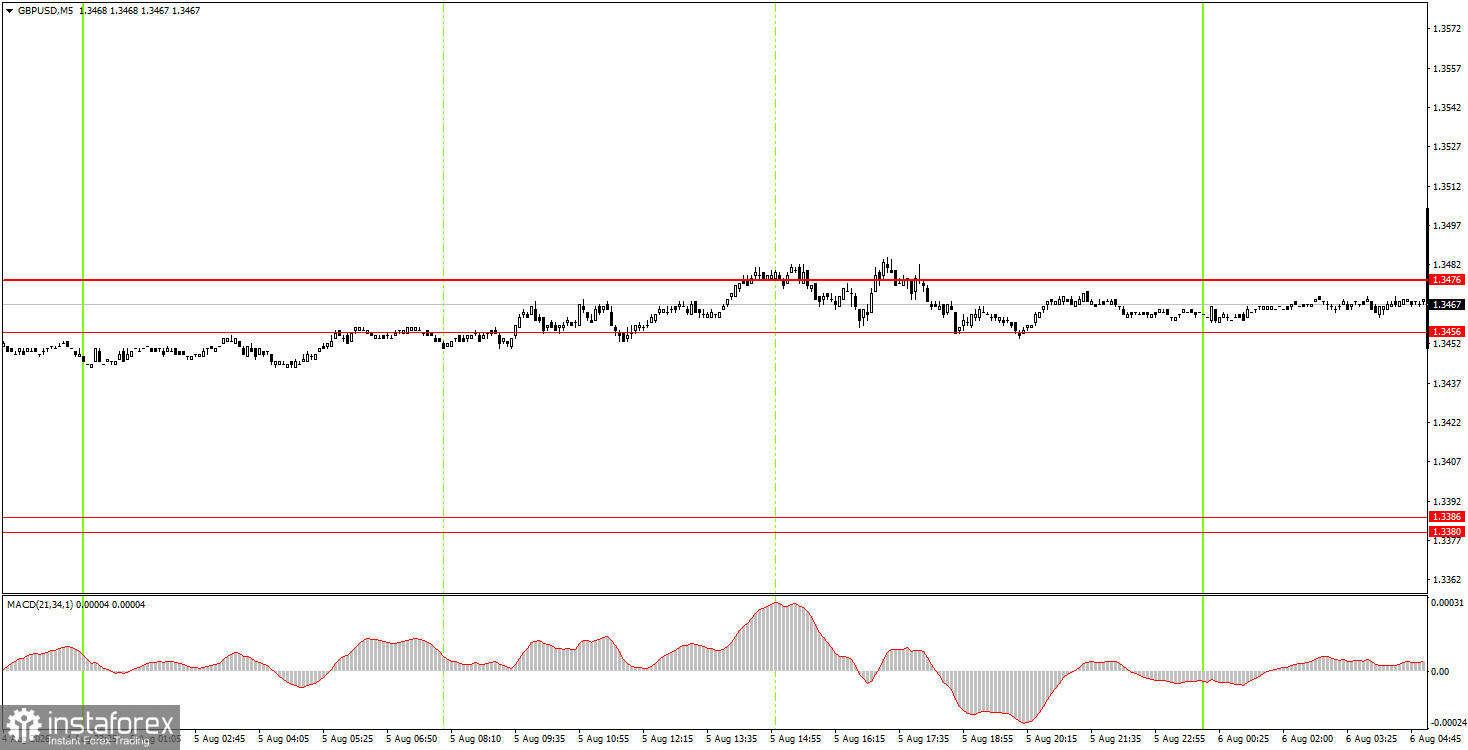
On the 5-minute timeframe, the pair entered the 1.3456–1.3476 area and spent the whole day there. Thus, no trading signals were formed during the day. Today, a signal may form, since the price cannot trade in a 20-pip range for long.
On the hourly timeframe, the GBP/USD pair maintains an upward trend. In our view, the pound will continue to rise even if local factors do not support it. On the weekly timeframe, the movement from the lower boundary of the sideways channel to the upper boundary began a month ago. That movement is not yet complete. Belief in a Fed rate hike in September is evaporating, the market is no longer paying much attention to geopolitics, and technicals are supporting the pound's rise.
On Thursday, novice traders may open short positions if the pair consolidates below the 1.3456–1.3476 area, targeting 1.3380–1.3386. Long positions can be considered if the pair consolidates above 1.3456–1.3476, with targets at 1.3587–1.3598.
On the 5-minute timeframe one can trade using the levels 1.3096–1.3107, 1.3175–1.3180, 1.3259–1.3267, 1.3319–1.3331, 1.3380–1.3386, 1.3456–1.3476, 1.3587–1.3598, 1.3631–1.3641, 1.3695. There are no important events scheduled in the UK on Thursday, and the U.S. will release only the secondary jobless claims report. Therefore, strong moves are unlikely today.
Support and resistance price levels (areas) are the targets when opening buy or sell orders or sources of signals.
Red lines denote channels or trend lines that reflect the current trend and indicate in which direction trading is currently favored.
The MACD indicator (14,22,3) – histogram and signal line – is a supporting indicator that can also be used as a source of signals.
Important speeches and reports (as listed in the news calendar) can significantly influence the movement of the currency pair. Therefore, during their release, trading should be approached with utmost caution, or one should exit the market to avoid sharp price reversals against the preceding movement.
Beginners in Forex trading should remember that not every trade can be profitable. Developing a clear strategy and proper money management are essential for long-term trading success.
InstaForex analytical reviews will make you fully aware of market trends! Being an InstaForex client, you are provided with a large number of free services for efficient trading.


