 Maradok
Kereskedési feltételek
Products
Eszkozok



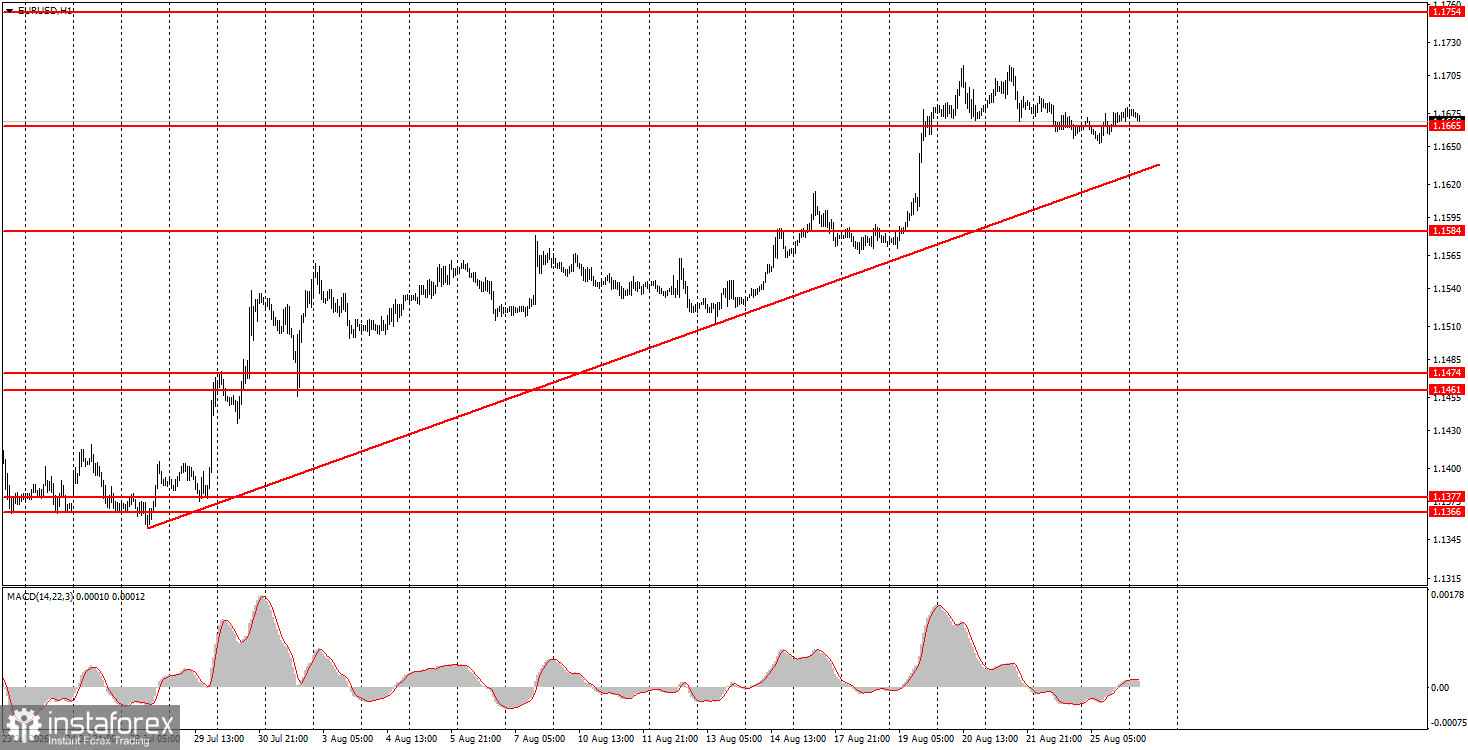
The EUR/USD currency pair showed no interesting movements during trading on Tuesday. Despite several macroeconomic publications throughout the day in Germany and the U.S., the overall volatility was less than 30 pips. The European currency remains above the trend line, so the trend remains intact. Only a price consolidation below the trend line would allow the dollar to improve its dismal position slightly.
Returning to yesterday's reports and events, we initially stated that the market should not be expected to react to clearly secondary reports. Today, the situation may change, as important reports on GDP, PCE, and durable goods orders will be released in the U.S. However, we believe the market may well ignore these publications as well. Low volatility has been recorded for three weeks now, indicating a general reluctance of the market to move. It seems we will have to wait until Friday for the market to awaken somewhat.
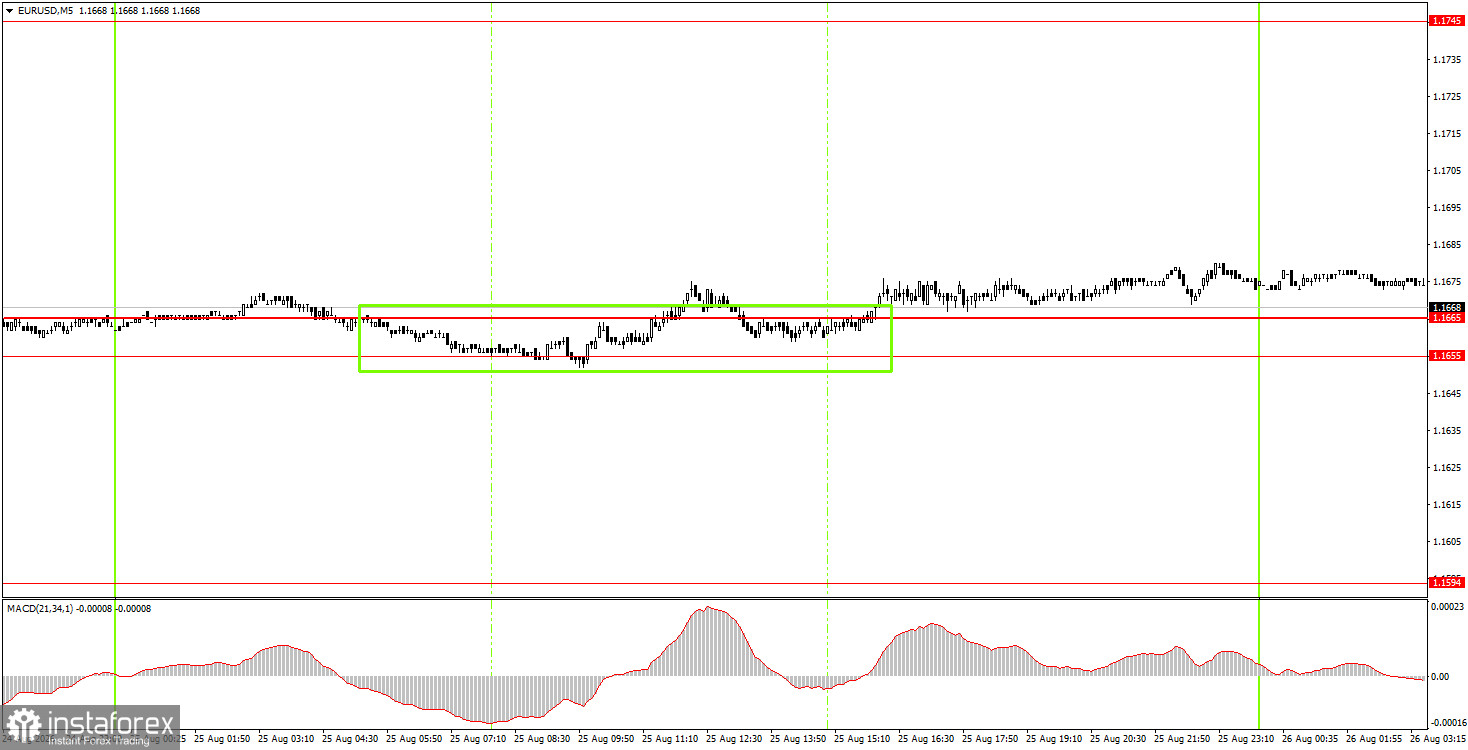
On the 5-minute timeframe, a single buy signal was formally formed on Tuesday. At around 10 AM, the price attempted to rebound from the 1.1655-1.1665 area, ultimately succeeding. However, whether the upward movement will continue remains unclear. Volatility remains very weak.
On the hourly timeframe, the EUR/USD pair continues to form an upward trend. Considering all the events of recent months, we believe that the European currency should continue its steady growth even without local support. Currently, there are no factors for growth in the American currency, so we continue to expect upward movement.
On Wednesday, novice traders may consider short positions with targets of 1.1584-1.1594 if the price settles below the 1.1655-1.1665 area. Long positions can be initiated on a bounce from the 1.1655-1.1665 area, targeting 1.1745-1.1754.
On the 5-minute timeframe, traders should consider levels 1.1366-1.1377, 1.1461-1.1474, 1.1527-1.1531, 1.1584-1.1594, 1.1655-1.1665, 1.1745-1.1754, and 1.1830-1.1837. On Wednesday, there are no significant events or publications scheduled in Germany and the Eurozone, while the U.S. will release relatively important reports on PCE, GDP, and durable goods orders. We believe that a market reaction to this data may occur, but it is unlikely to be strong.
Support and resistance price levels (areas) are the targets when opening buy or sell orders or sources of signals.
Red lines denote channels or trend lines that reflect the current trend and indicate in which direction trading is currently favored.
The MACD indicator (14,22,3) – histogram and signal line – is a supporting indicator that can also be used as a source of signals.
Important speeches and reports (as listed in the news calendar) can significantly influence the movement of the currency pair. Therefore, during their release, trading should be approached with utmost caution, or one should exit the market to avoid sharp price reversals against the preceding movement.
Beginners in Forex trading should remember that not every trade can be profitable. Developing a clear strategy and proper money management are essential for long-term trading success.
InstaForex analytical reviews will make you fully aware of market trends! Being an InstaForex client, you are provided with a large number of free services for efficient trading.


