 Maradok

Kereskedési feltételek
Products
Eszkozok


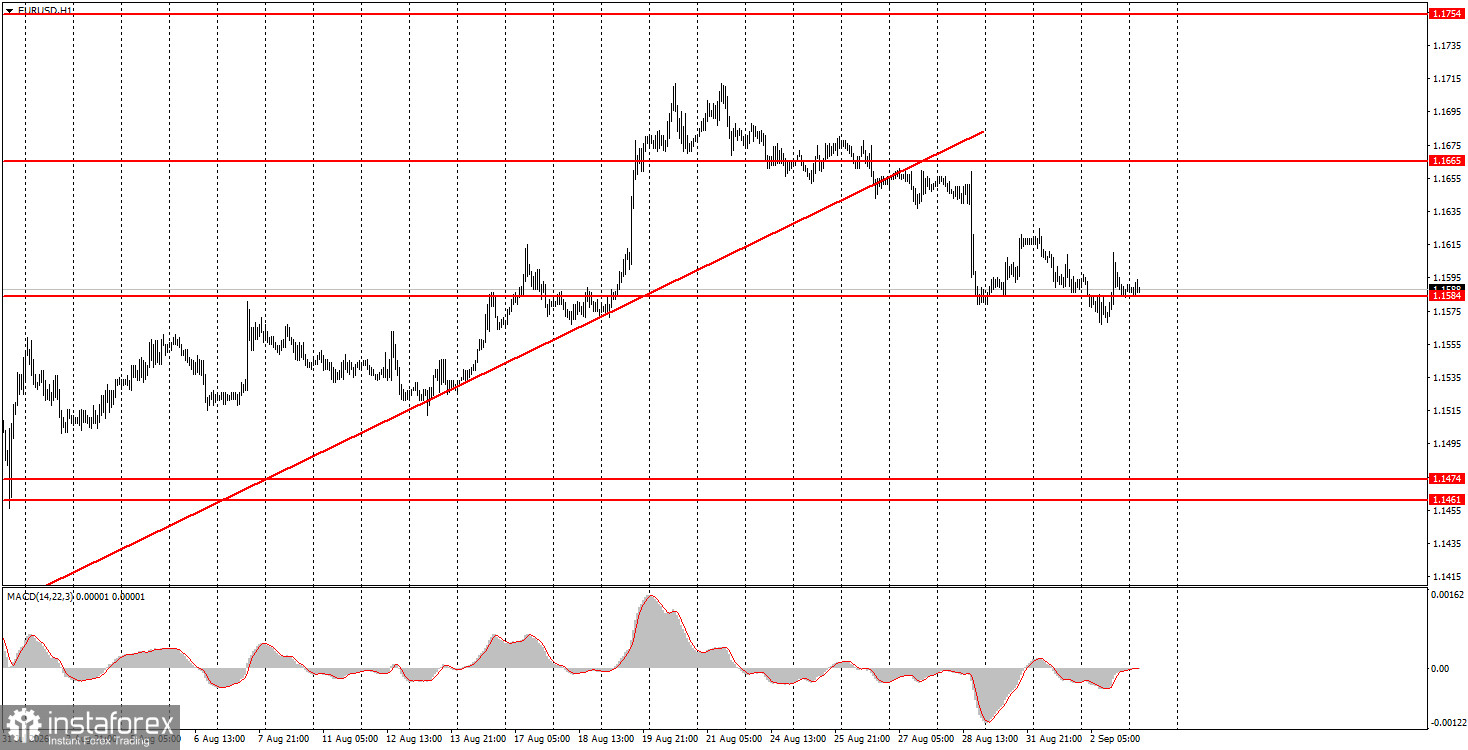
On Wednesday, the EUR/USD currency pair tried to continue downward after breaking the ascending trend line, but it is now rather difficult for the dollar to keep rising. Recall that global factors continue to support every currency except the U.S. dollar, and even over the past two weeks (during which the dollar strengthened) there were virtually no solid reasons for its rise. For example, this week the U.S. released four relatively important reports on the labor market and business activity, and none of them supported the American currency. Thus, the current strengthening of the dollar is purely corrective, driven by technical factors and by the market's belief in Federal Reserve tightening in September. Last Friday, Fed Chair Kevin Warsh once again spoke about high inflation in the U.S., which the market interpreted as a signal that tightening may be forthcoming. That is why the dollar is rising, despite the weak labor-market indicators.
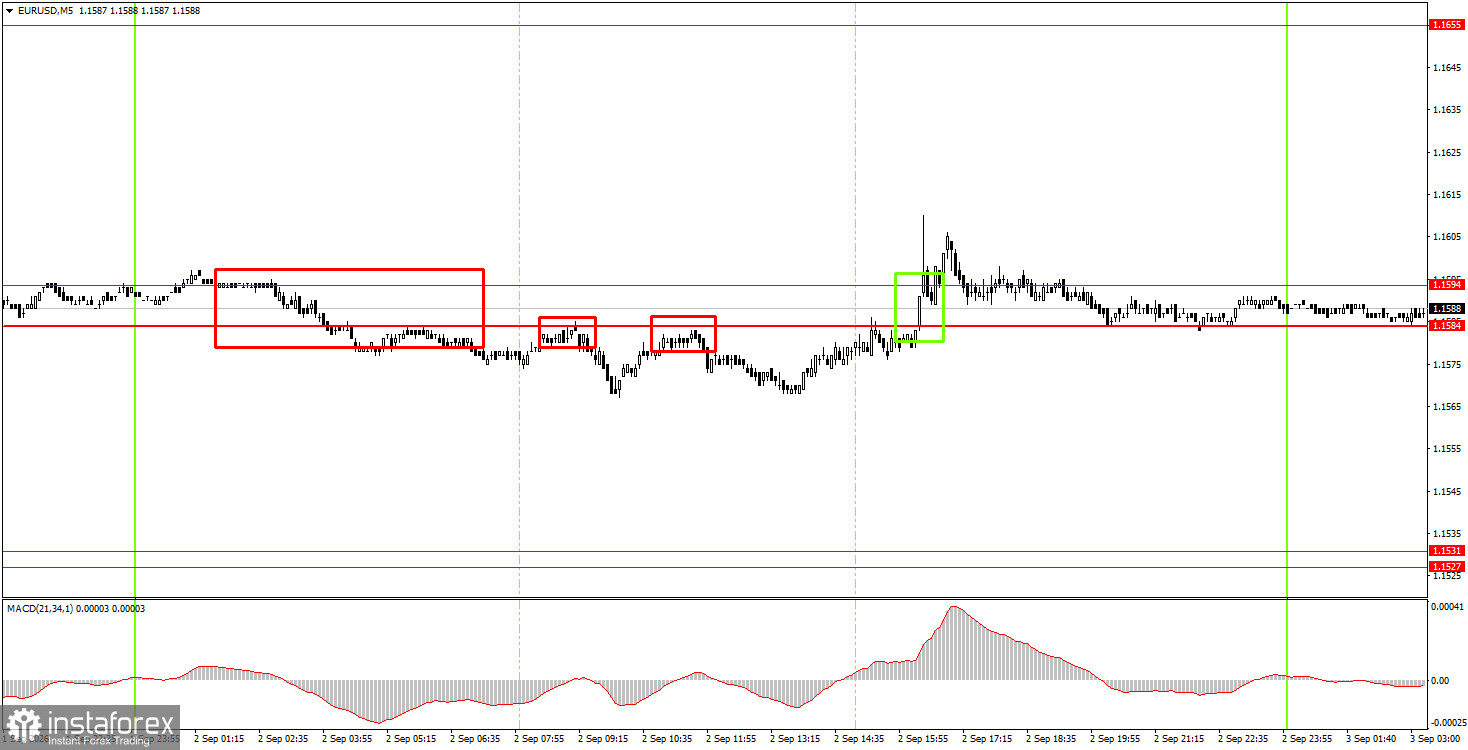
In the 5-minute timeframe on Wednesday, four trading signals formed, but traders spent most of the day indecisive about direction. First, the price bounced three times from the 1.1584–1.1594 area but failed to move even 15 pips in the desired direction. Later, there was a consolidation above 1.1584–1.1594, but the pair could not continue higher either.
On the hourly timeframe, EUR/USD remains in a correction after a month of growth. Considering all recent events, we believe the euro should continue to rise steadily even without local support. The U.S. currency currently has no growth drivers other than the market's near-religious belief in a Fed rate hike.
On Thursday, novice traders may consider short positions targeting 1.1527–1.1531 if price settles below the 1.1584–1.1594 area. Long positions can be opened on a rebound from 1.1584–1.1594, targeting 1.1655–1.1665.
On the 5-minute timeframe, consider these levels: 1.1366–1.1377, 1.1461–1.1474, 1.1527–1.1531, 1.1584–1.1594, 1.1655–1.1665, 1.1745–1.1754, 1.1830–1.1837. On Thursday, the Eurozone and Germany will publish second-estimate services PMIs, and in the U.S., claims for unemployment benefits and the ISM services index will be released. We recommend paying particular attention to the ISM services index.
Price levels (areas) of support and resistance are levels that serve as targets when opening buy or sell trades, or as sources of signals.
Red lines indicate channels or trend lines that illustrate the current trend and show the preferred direction for trading at the moment.
The MACD indicator (14,22,3) — the histogram and signal line — is an auxiliary indicator that can also be used as a source of signals.
Important speeches and reports (contained in the news calendar) can significantly influence the movement of currency pairs. Therefore, during their release, trading should be approached with utmost caution, or traders should exit the market to avoid sudden reversals against the preceding movement.
Beginner forex traders should remember that not every trade can be profitable. Developing a clear strategy and practicing money management are key to long-term success in trading.
InstaForex analytical reviews will make you fully aware of market trends! Being an InstaForex client, you are provided with a large number of free services for efficient trading.


