 Maradok

Kereskedési feltételek
Products
Eszkozok


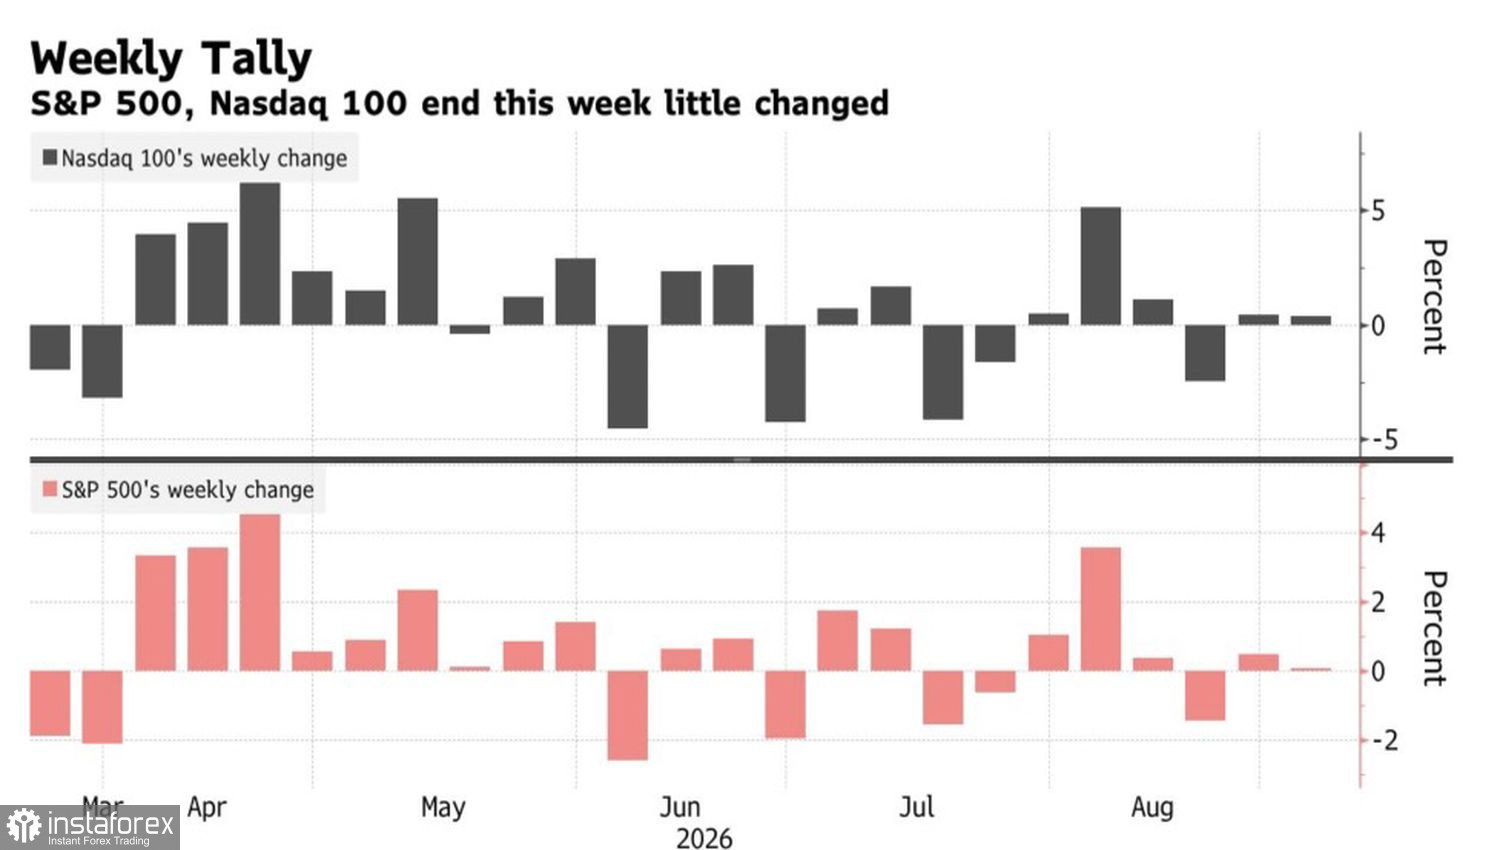
The US economy added 162,000 jobs in August, nearly three times consensus, marking a sharp rebound from July's 21,000. What's good news for the labor market has turned into bad news for equities: the S&P 500 closed lower, with consumer discretionary, healthcare and energy among the biggest decliners.
Stock index performance
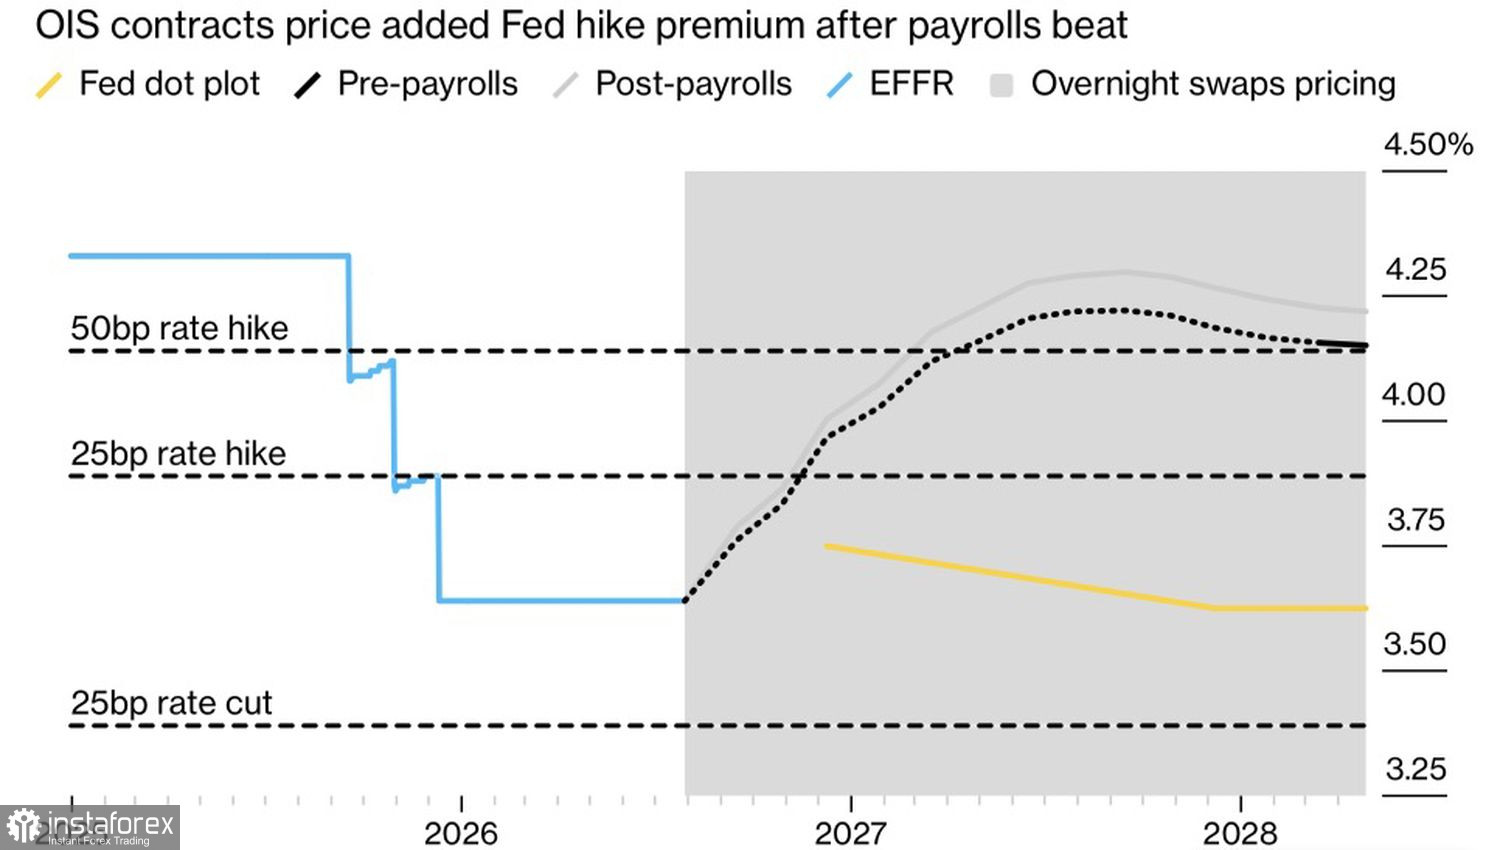
Why? Strong payrolls remove the Fed's clearest excuse to hold off on a Sept. 16 rate hike. The odds of tightening jumped from 52% to 60% immediately after the release. UBS Group now models two rate hikes, in September and December, even as US President Donald Trump called for lower interest rates, citing a "much stronger" US credit picture. Markets, however, clearly fear the opposite scenario.
Meanwhile, the Wall Street fear gauge, the VIX, sits calmly around 14,more than 20% below its annual average, as if unaware of the nervousness beneath the surface. And there is reason to be uneasy: utilities, normally the market's quietest sector, are now one of the two worst performers year?to?date after an extraordinary surge of over 11% through late February.
Dynamics of market expectations for Fed funds rate
That quiet is the key signal. Utilities have long been the canary in the coal mine for equities — the sector most sensitive to the pace of Fed tightening because it depends on cheap borrowing and steady dividends. History supports the metaphor: the Dow Jones Utility Average led the S&P 500 peak in 21 of the last 30 bull-market tops since 1930, and after each such lead, indices have retraced more than 29% on average.
For now, the upswing is intact and corporate profits continue to feed the rally — the S&P 500 is up about 13% year-to-date. The question is how long that buffer will hold. Traders are shifting focus to Friday's consumer price data. Those numbers, not a single jobs report, will decide whether inflation stays above the Fed's 2% target and whether the central bank must tighten further.
So the market is in an uncomfortable trap: the stronger the economy, the scarier it looks for investors. Will Wall Street heed the canary's warning before it is too late?
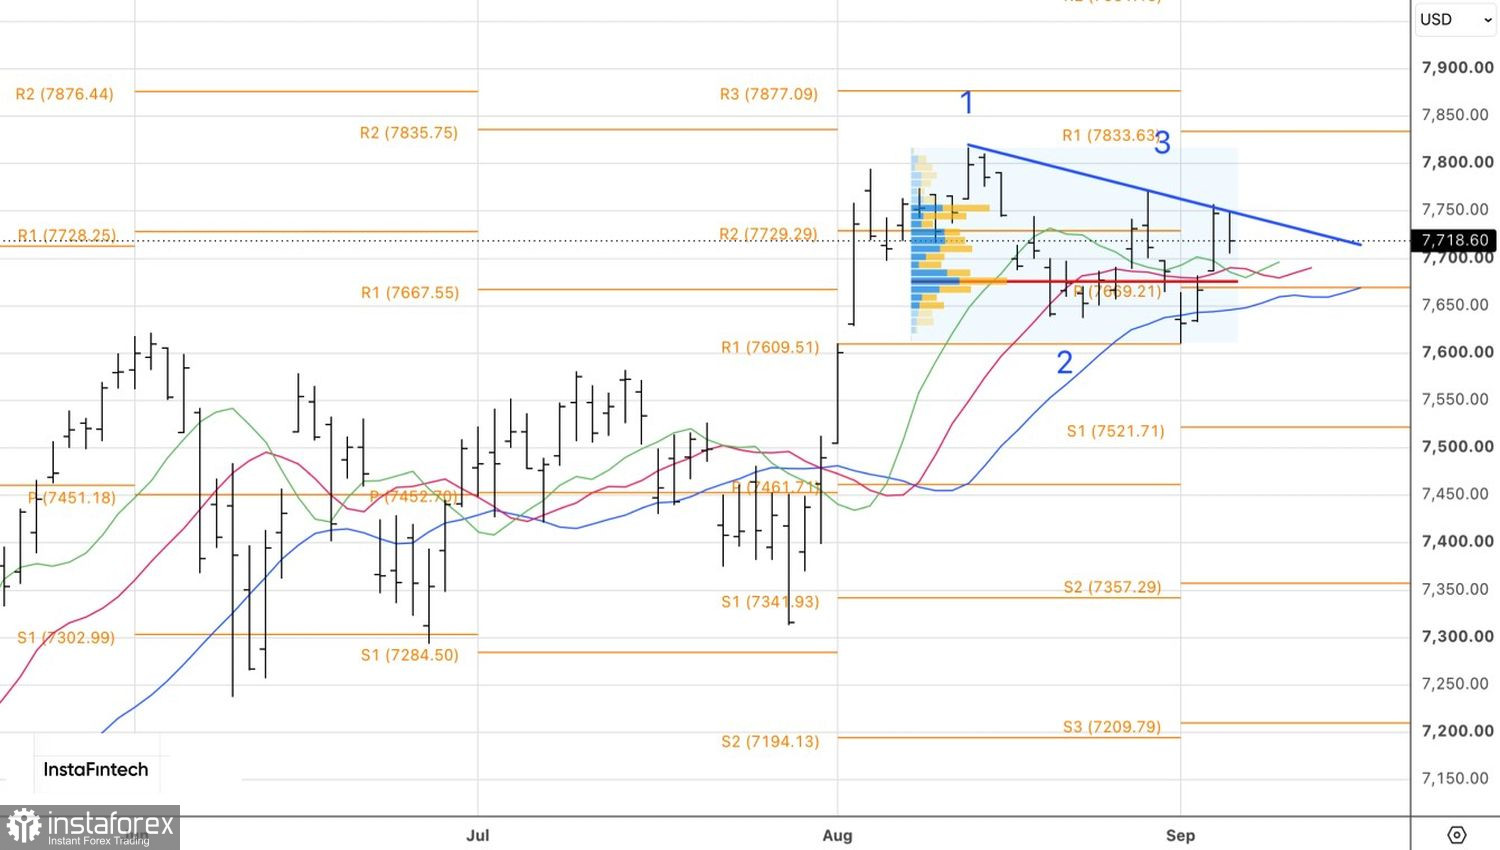
Technically, the daily S&P 500 chart shows a bounce off the trendline within a Three Touch pattern. The 1-2-3 reversal scenario can still be revived. A break below fair value at 7,675 would be a sell signal. Conversely, reclaiming levels above 7,755 would give bulls reason to buy.
InstaForex analytical reviews will make you fully aware of market trends! Being an InstaForex client, you are provided with a large number of free services for efficient trading.


