 Maradok

Kereskedési feltételek
Products
Eszkozok


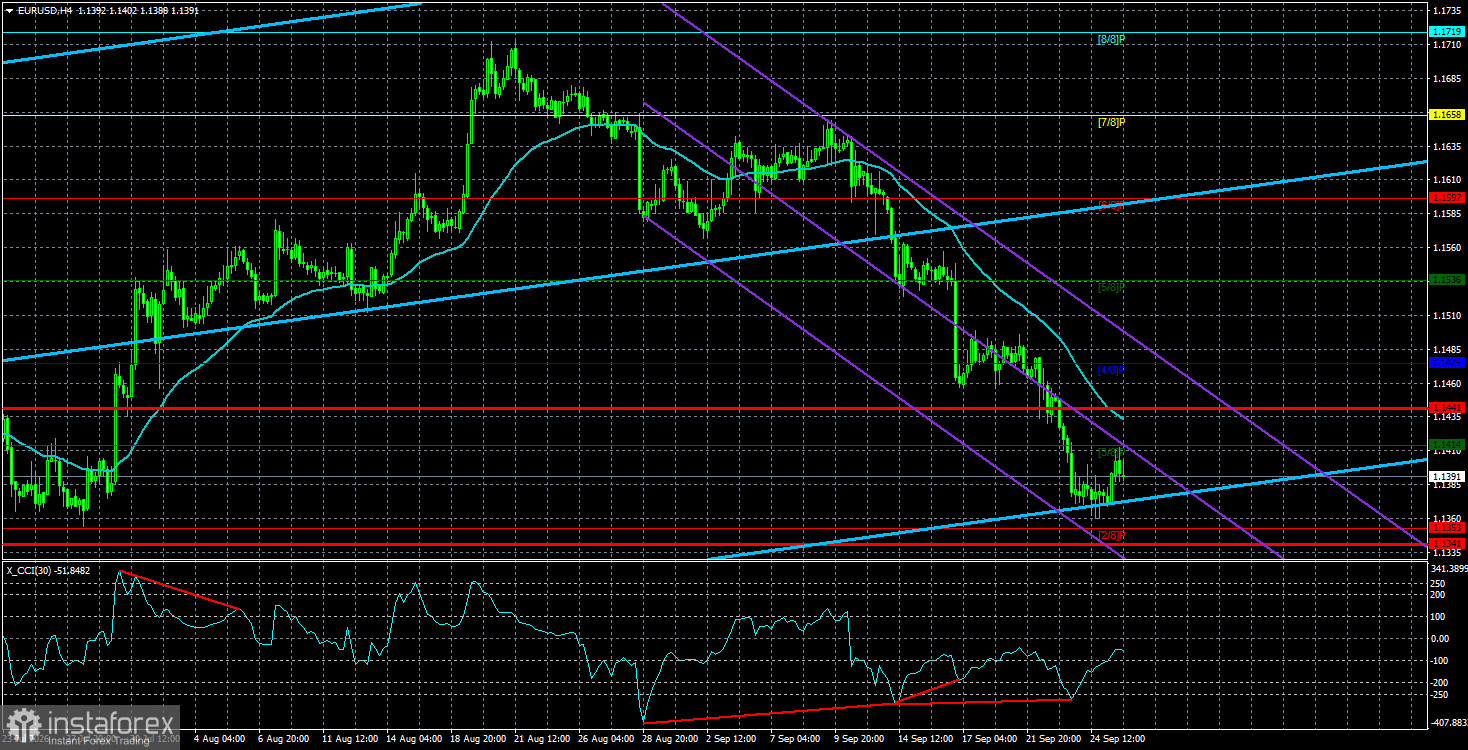
The EUR/USD pair made only a minimal correction on Friday—so slight it's hard to spot on the charts. The market continues buying the US currency on any pretext, while in moments free from nods to the Federal Reserve it puzzles over what exactly is driving such a sharp and strong dollar rally. A common view is that the dollar's rise is based on a pronounced hawkish shift in Fed policy. We would remind readers that the market began expecting rate hikes already in the summer, and that factor was priced in several times before the Fed meeting. Granted, traders may not have anticipated the dot-plot showing at least one more hike this year, but that too has already been digested, given the dollar's three full weeks of gains.
We believe the current decline in the pair has taken on the character of a fully illogical, inertial and uncontrolled move. The market refuses to acknowledge similar European Central Bank tightening, and explanations such as "ECB rates are below Fed rates" do not work because that was true before as well—and was already accounted for. Therefore, we think this movement will end only when the market becomes saturated with dollar purchases. On the weekly timeframe, this year's dollar strength remains a weak correction, while the daily timeframe still shows signs of a year-long flat. So, however strong and abrupt the dollar's rise in 2026, it cannot be taken as decisive in the long term.
This week the US Nonfarm Payrolls report will be published; other macro events are not worth discussing because the market largely ignores them. Thus everything will boil down to market expectations for NFP and the actual print. Recall that last week several FOMC members said the risks from a slowing US labor market are smaller than the risks from rising inflation. Essentially, the Fed has bet on fighting inflation, so NFP outcomes supposedly matter less for policy from that perspective.
That said, as we have noted, traders have already priced in Fed tightening multiple times, and a weak Nonfarm Payrolls print could cool FOMC officials' ardor. The US labor market is far from perfect. Tighter monetary policy will slow the economy—that is the point of tightening. Last year the Fed eased policy to support the labor market; this year tightening will slow it. Consequently, a poor NFP reading could not only push the dollar sharply lower on Friday, but also mark an end to the dollar's three-week run. The dollar has no fundamental reason to rise further, though it may continue for a time on inertia.
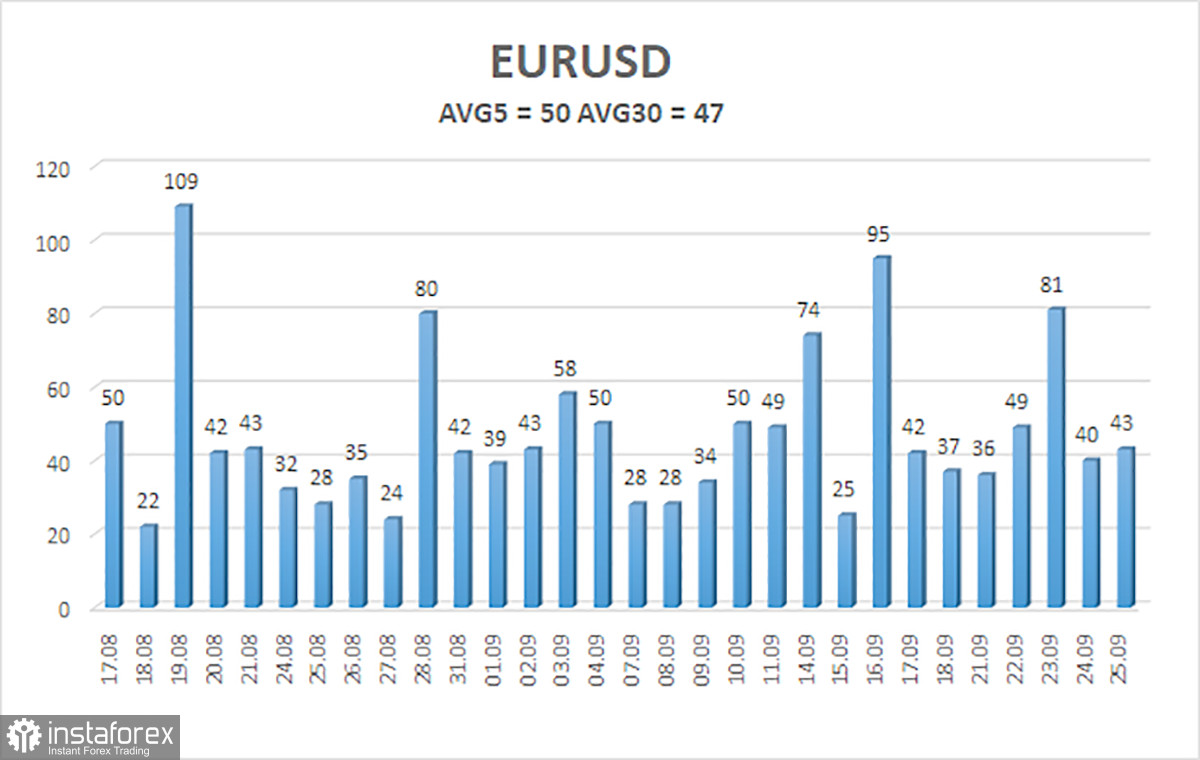
The average volatility of the EUR/USD currency pair over the last 5 trading days as of September 28 is 50 pips and is characterized as "average." We expect the pair to move between 1.1341 and 1.1441 on Monday. The higher linear regression channel is pointing upward, indicating an uptrend. The CCI indicator entered the oversold area three times and formed three "bullish" divergences, which warn of the end of the illogical downward trend. However, the market is not reacting to anything right now.
S1 – 1.1353
S2 – 1.1292
S3 – 1.1230
R1 – 1.1414
R2 – 1.1475
R3 – 1.1536
The EUR/USD pair continues to move downward, but we still view the decline as a correction before a new upward trend. The global fundamental backdrop for the dollar remains negative, but in 2026, geopolitics first, and then the Fed's hawkish stance, provided strong support to the US currency. When price is below the moving average, short positions can be considered with targets of 1.1353 and 1.1341. Above the moving average, long positions are relevant with targets of 1.1475 and 1.1536.
Regression channels help determine the current trend. If both are directed in the same direction, it means the trend is currently strong;
The moving average line (settings 20,0, smoothed) defines the short-term trend and the direction in which trading should be conducted at present;
Murray levels are target levels for moves and corrections;
Volatility levels (red lines) are the probable price channel within which the pair will spend the next 24 hours based on current volatility indicators;
The CCI indicator – its entry into the oversold area (below -250) or the overbought area (above +250) indicates that a trend reversal in the opposite direction is approaching.
InstaForex analytical reviews will make you fully aware of market trends! Being an InstaForex client, you are provided with a large number of free services for efficient trading.


