 Maradok
Kereskedési feltételek
Products
Eszkozok



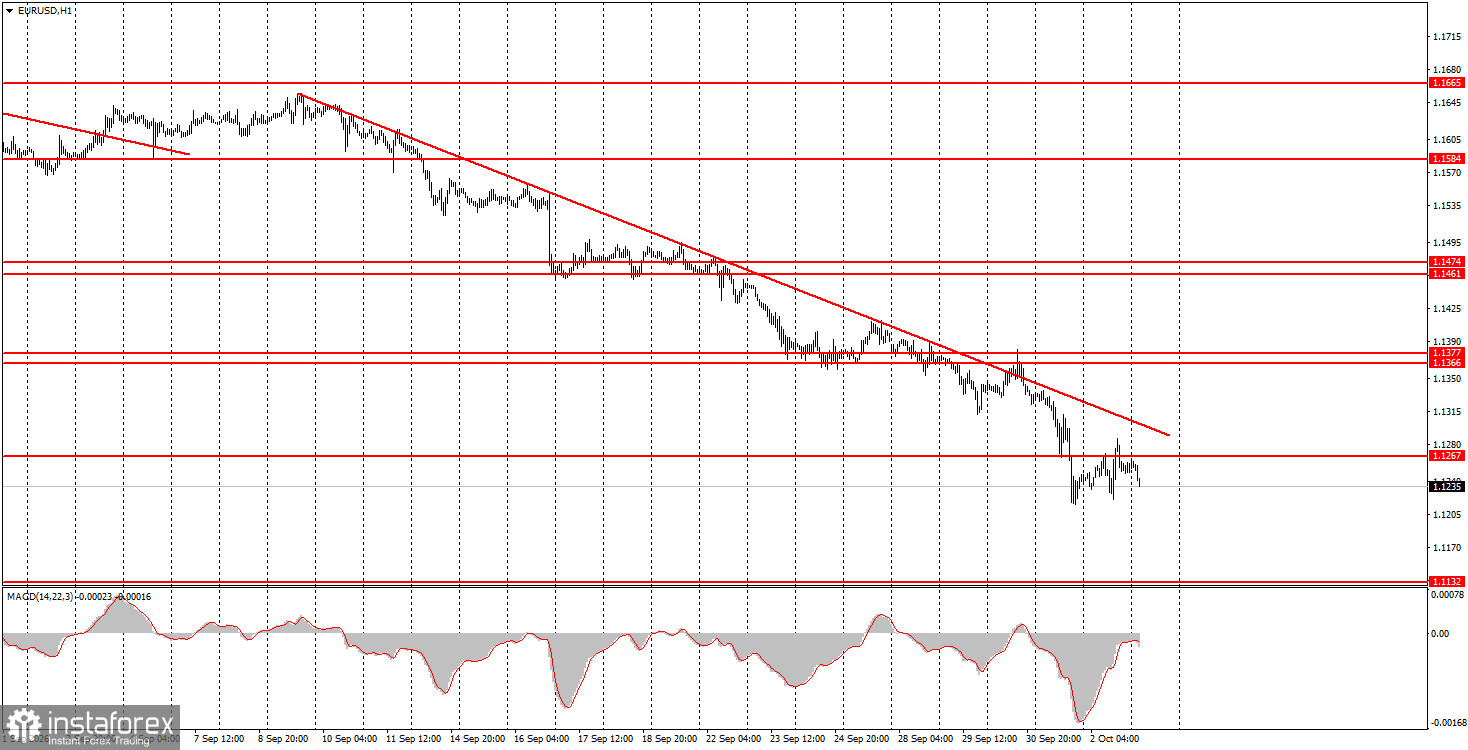
The EUR/USD currency pair showed movements on Friday that were hard to explain. That day the US released Nonfarm Payrolls and the unemployment rate, and the Eurozone published September inflation. Without going into details, one can safely say all three key reports favored the euro. The US labor market again showed disappointing results, unemployment rose, and Eurozone inflation exceeded forecasts, significantly increasing the chances of a third European Central Bank tightening this year. How did the market react? Practically not at all. The euro rose only about 10 pips for the day and by Monday night calmly resumed its decline. As we said before, the market refuses to take into account factors positive for the euro and refuses to buy euros. Only the dollar is rising, and it rises for any reason and on any grounds.
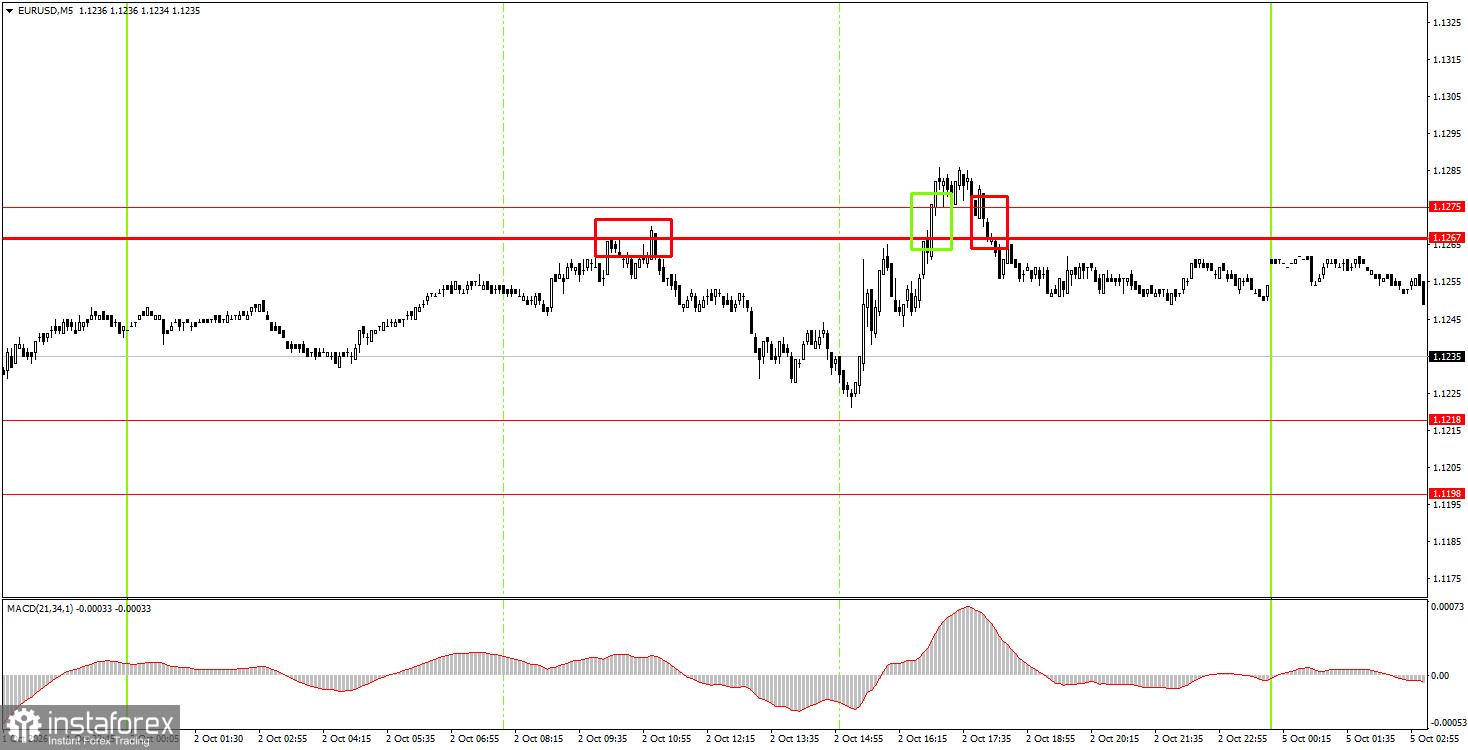
On the 5-minute TF on Friday, several trading signals were formed that did not correlate at all with the macroeconomic background. During the European session, price bounced off the 1.1267–1.1275 area and showed a decent decline, but in the American session two signals formed and both proved false. Instead of a powerful upward move, we saw further convulsions and illogical trading signals.
On the hourly timeframe, EUR/USD continues the downward trend, which is now a full-fledged trend. Given recent events, we do not expect the euro to plummet like a stone. But the market continues to buy the US dollar, ignoring any events and releases.
On Monday, novice traders can consider short positions on a rebound from the 1.1267–1.1275 area or on consolidation below the 1.1198–1.1218 area. Open long positions on a bounce from the 1.1198–1.1218 area, targeting 1.1267–1.1275.
On the 5-minute TF consider the levels 1.1132–1.1140, 1.1198–1.1218, 1.1267–1.1275, 1.1366–1.1377, 1.1461–1.1474, 1.1527–1.1531, 1.1584–1.1594, 1.1655–1.1665. On Monday, the only major event worth attention is the US ISM services index. However, Friday once again showed and proved that the market does not react to factors positive for the euro and continues selling EUR/USD.
Price levels (areas) of support and resistance serve as targets for opening buy or sell trades or as sources of signals.
Red lines indicate channels or trend lines that show the current trend and the preferred trading direction.
The MACD indicator (14,22,3) — the histogram and signal line — is an auxiliary indicator that can also provide signals.
Important speeches and reports (listed in the news calendar) can significantly influence currency pair movements. Therefore, during their release, traders should approach trading with utmost caution, or exit the market to avoid sudden reversals against the preceding move.
Beginner forex traders should remember that not every trade can be profitable. Developing a clear strategy and practicing money management are key to long-term success in trading.
InstaForex analytical reviews will make you fully aware of market trends! Being an InstaForex client, you are provided with a large number of free services for efficient trading.


