 Rimani
Condizioni di trading
Strumenti


EUR/USD 1H
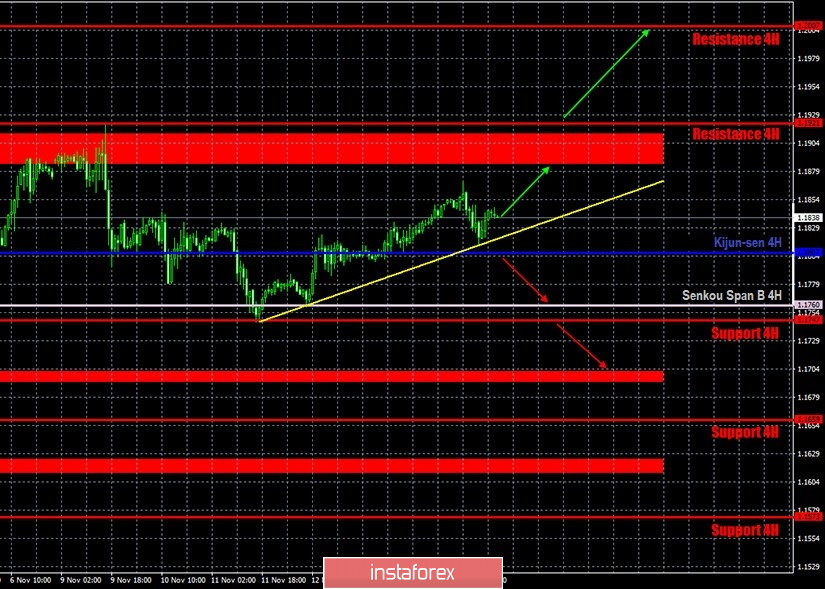
The euro/dollar pair moved up on the hourly timeframe on Monday, November 16, but a new round of the downward movement began in the afternoon. The nature of the current movement is still extremely suitable for a flat, which stays in the long term. Recall that the pair's quotes have been trading between the levels of 1.1700 and 1.1900 for three months now. Thus, 80% of trades are within the specified range. Naturally, trends are not always formed within this range. It would be too ideal for quotes to reach one of the channel's boundaries, rebound off it and start moving towards the opposite boundary. Therefore, in reality, the lateral movement stays, but it is less of a good view. The Kijun-sen line went down yesterday, so the price remained above it, despite the downward correction. Therefore, rebounding from this line may help traders with long deals while they aim for the resistance area of 1.1886-1.1912. For something more, buyers need to go beyond the specified area, but even then, the breakout can be false.
EUR/USD 15M
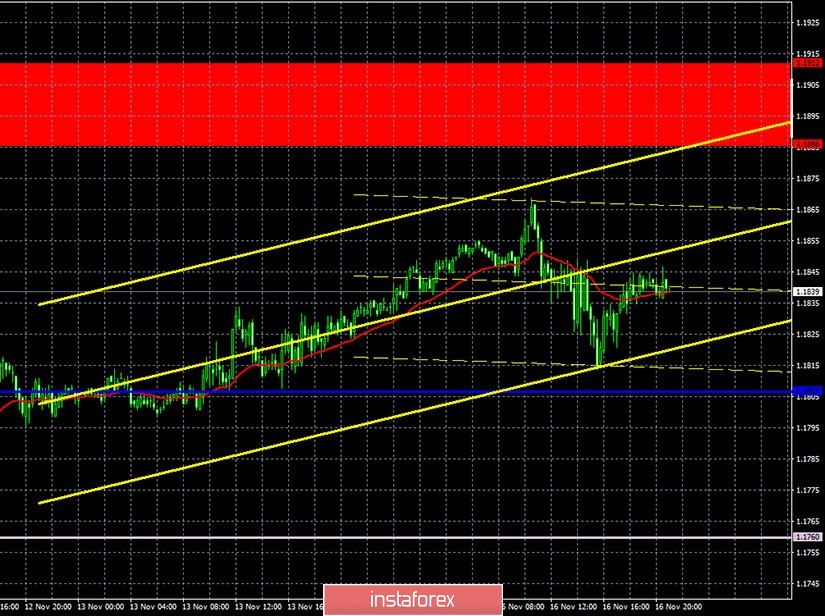
Both linear regression channels are directed to the upside on the 15-minute timeframe. Therefore, not breaking the Kijun-sen line still allows traders to form an upward trend in the short term. The upward movement to the 1.1886-1.1912 area can only continue if the Kijun-sen line is not overcome.
COT report
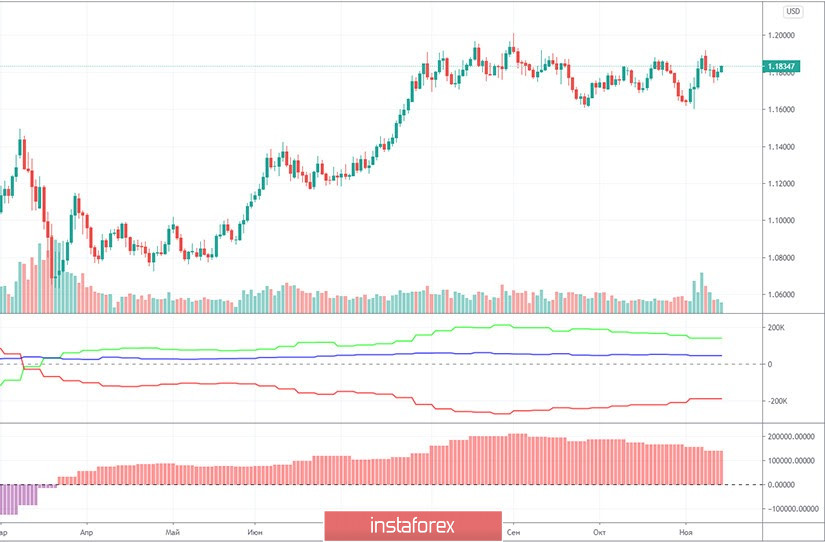
The EUR/USD pair increased by 170 points in the last reporting week (November 3-9). The US presidential elections provoked a rather strong drop in the US currency, however, it lasted no more than a few days. Nevertheless, the euro rose in price, and market participants can expect that professional traders are leaning towards being bullish. However, the latest Commitment of Traders (COT) report showed that the mood of large traders has become more bearish. The net position of the "non-commercial" group of traders decreased again, this time by 17,000 contracts, which is quite a lot. Recall that non-commercial traders have been reducing their net position for several consecutive weeks, which is eloquently signaled by the lower indicator in the chart. A decrease in the net position, in fact, means that Buy-contracts (longs) are closed and Sell-contracts (shorts) are opened. The first professional traders closed 9,200 during the reporting week, and the second - opened 7,800. However, despite the fact that the net position of non-commercial traders has been falling since the beginning of September, the downward trend has still not started for the EUR/USD pair. The green and red lines on the first indicator continue to move towards each other, which means that the trend has already begun long ago. However, there is actually no downward movement in the long term. Therefore, based on the latest COT report, we can say the following: our forecasts remain the same, since the report data allows only such conclusions to be drawn. We still believe that the upward trend has ended at around 1.2000.
No important macroeconomic reports for the European Union and the United States on Monday. There were only a few messages that, purely theoretically, could have an impact on the pair's movement. We have Donald Trump's new insinuations, information about possible new sanctions by Washington against Beijing as a "slamming door", and the speech of European Central Bank President Christine Lagarde, who did not say anything important nor anything related to monetary policy or the economy. Recently, Lagarde has paid increased attention to the pandemic, the vaccine against the coronavirus, as well as the digital euro, which may be launched within a few years. However, all this information was interesting only in general.
Lagarde is set to deliver another speech on Tuesday, November 17. And, most likely, the head of the ECB will also avoid discussing the economy and monetary policy. Meanwhile, the US will release its retail sales report for the month of October. According to forecasts, it might increase 0.5% m/m, which is very small compared to September's results, which grew 1.9% m/m. However, in the current environment, this report is unlikely to cause a strong market reaction. In general, we do not yet see what fundamental news can bring the pair out of the $1.17-1.19 channel.
We have two trading ideas for November 17:
1) Buyers kept the pair above the Senkou Span B line (1.1807), as well as above the new upward trend line. Therefore, you are advised to trade upward while aiming for the resistance area of 1.1886-1.1912 and the resistance level of 1.2007. Take Profit in this case will be about 50 to 150 points.
2) At first, the bears failed to overcome the Senkou Span B line (1.1760), and then the trend line. Thus, in order to be able to resume trading downward while aiming for the Senkou Span B line (1.1760) and the support area of 1.1692-1.1699, the price should settle below the trend line and break the Kijun-sen line (1.1807). Take Profit in this case can range from 30 to 80 points.
Hot forecast and trading signals for GBP/USD
Explanations for illustrations:
Support and Resistance Levels are the levels that serve as targets when buying or selling the pair. You can place Take Profit near these levels.
Kijun-sen and Senkou Span B lines are lines of the Ichimoku indicator transferred to the hourly timeframe from the 4-hour one.
Support and resistance areas are areas from which the price has repeatedly rebounded off.
Yellow lines are trend lines, trend channels and any other technical patterns.
Indicator 1 on the COT charts is the size of the net position of each category of traders.
Indicator 2 on the COT charts is the size of the net position for the "non-commercial" group.
Le recensioni analitiche di InstaForex ti renderanno pienamente consapevole delle tendenze del mercato! Essendo un cliente InstaForex, ti viene fornito un gran numero di servizi gratuiti per il trading efficiente.

