 Anuluj
Warunki handlowe
Narzędzia


To open long positions on EURUSD, you need:
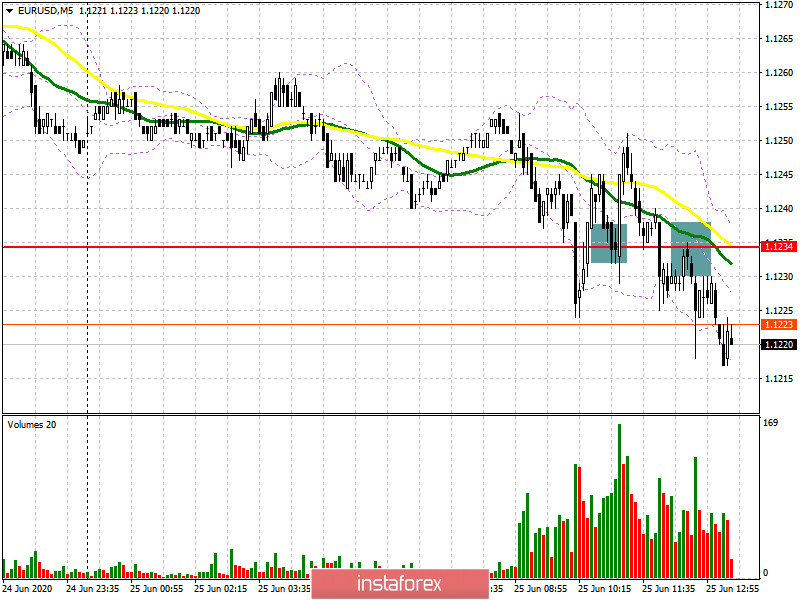
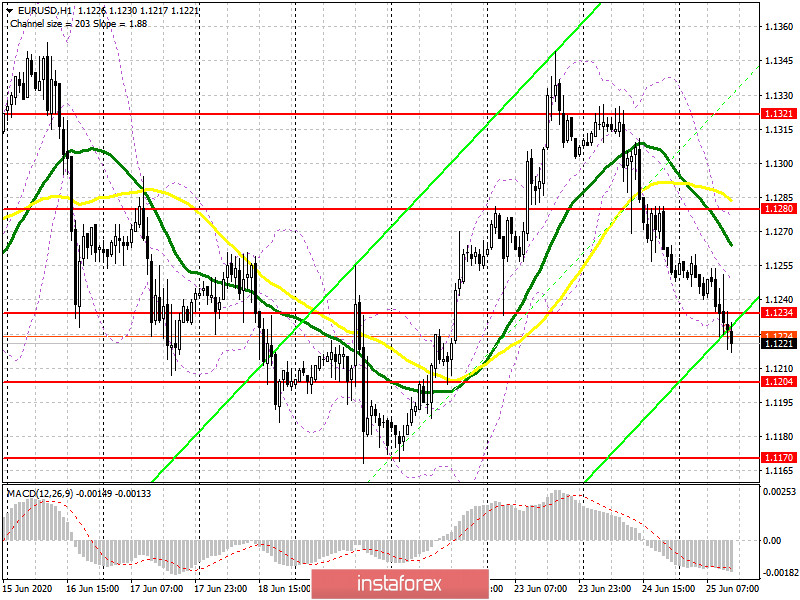
In the first half of the day, several signals for entering the market were formed at once. If you look at the 5-minute chart, at the very beginning, you will see how the bulls formed a false breakout in the support area of 1.1234 and tried to build an upward correction from it. However, this did not lead to anything good, although the signal was quite good. Unfortunately, this happens. Then, closer to the middle of the day, the bears gradually pushed the euro back to the level of 1.1234 and achieved a consolidation below this range, which was a signal to open short positions in the euro, which are still relevant at the time of writing. The entry point to the market was the test of the level of 1.1234 from the bottom up (marked on the chart). In the second half of the day, buyers need to step up their efforts to protect the support of 1.1204, to which the pair is heading. However, it is best to open long positions from there only after forming a false breakout, similar to the level of 1.1234. The further level, from which you can open long positions immediately on the rebound based on a correction of 30-40 points, will be the area of 1.1170. An equally important target for buyers of the euro remains the resistance of 1.1234, a return to which may occur after the publication of the European Central Bank's minutes from the last monetary policy meeting, as well as data on US GDP for the 1st quarter, which is likely to coincide with the forecasts of economists. Only then can we expect an upward correction of the euro/dollar pair to the resistance area of 1.1280, where the moving averages pass.
To open short positions on EURUSD, you need:
Sellers confidently bend their line, breaking through each time lower and lower. Fixing below the level of 1.1234 was a good signal to sell the euro, which I paid attention to in my morning forecast. We will find out what will happen in the near future. Bears are aiming to update support at 1.1204. If the US GDP data turns out to be better than the forecasts of economists, which is unlikely, you can count on a decrease in the pair to a minimum of 1.1170, where I recommend fixing the profits. In the scenario of buyers returning to the resistance of 1.1234 in the second half of the day, it is best not to rush to open short positions and wait for the test of a larger resistance of 1.1280, where the moving average also passes. From it, you can expect a correction of 20-30 points.
Signals of indicators:
Moving averages
Trading is below the 30 and 50 daily moving averages, which indicates a further decline in the euro.
Note: The period and prices of moving averages are considered by the author on the hourly chart H1 and differ from the general definition of the classic daily moving averages on the daily chart D1.
Bollinger Bands
The break of the upper limit of the indicator in the area of 1.1234 led to a new wave of decline in the pair. In the case of an upward correction in the second half of the day, the upper limit of the indicator will act as a resistance in the area of 1.1280, from where I recommend opening short positions immediately for a rebound.
Description of indicators
Dzięki analizom InstaForex zawsze będziesz na bieżące z trendami rynkowymi! Zarejestruj się w InstaForex i uzyskaj dostęp do jeszcze większej liczby bezpłatnych usług dla zyskownego handlu.

