 Anuluj
Warunki handlowe
Narzędzia


EUR/USD 1H
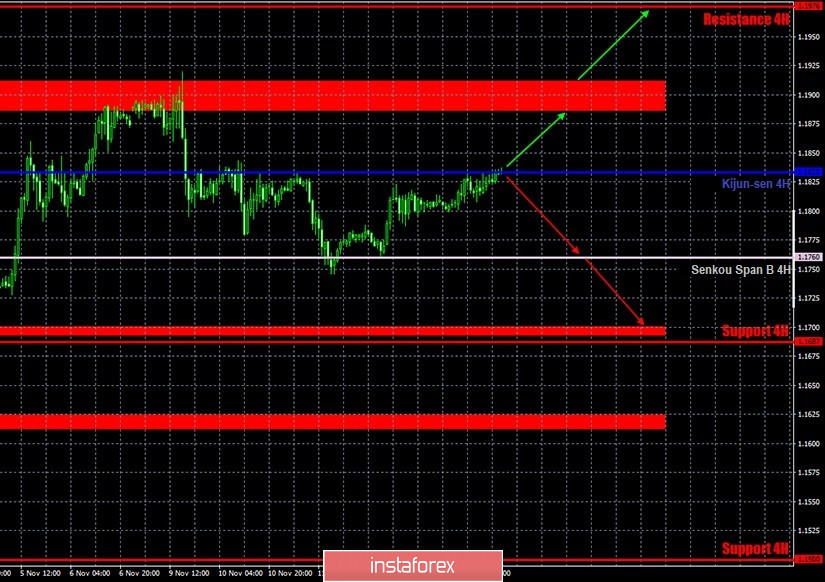
The euro/dollar pair continued to adjust on the hourly timeframe on November 13, and it reached the Kijun-sen line by the end of the day. Thus, the upward trend within the 1.1700-1.1900 horizontal channel is still present, as is the horizontal channel itself. Take note that the pair's quotes have been trading in between the levels of 1.1700 and 1.1900 for more than three months and only occasionally leave it for a short time. Short-term trends are formed within the channel from time to time. Traders do not have a trend line or a trend channel at their disposal at the moment. We make a conclusion about the upward trend solely based on the price rebounding from the Senkou span B line, which is a strong support. However, we can also conclude that the price is on a downward trend, since the price bounced from the resistance area of 1.1886-1.1912 earlier, failing to gain a foothold higher once again. Thus, it is best to trade on the rebound or once important lines of the Ichimoku indicator or important levels have been overcome. For example, the price rebounding from a critical line can trigger a round of downward movement, no matter what the current trend is.
EUR/USD 15M
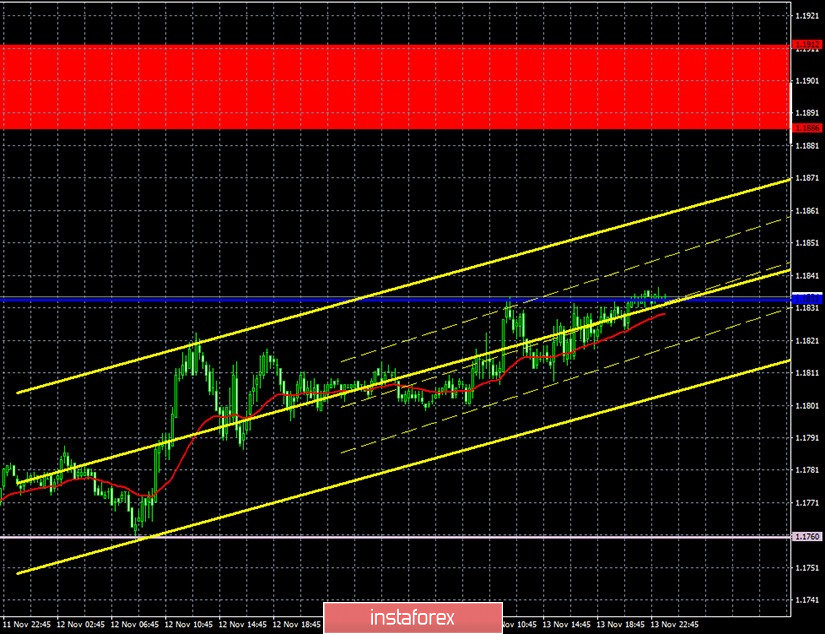
Both linear regression channels turned to the upside on the 15-minute timeframe. Not breaking the Senkou Span B line made it possible for traders to bring back the upward trend in the short term. However, the Kijun-sen line can stop this trend. Thus, the pair could move up to 1.1886-1.1912, but only if it overcomes the Kijun-sen line.
COT report
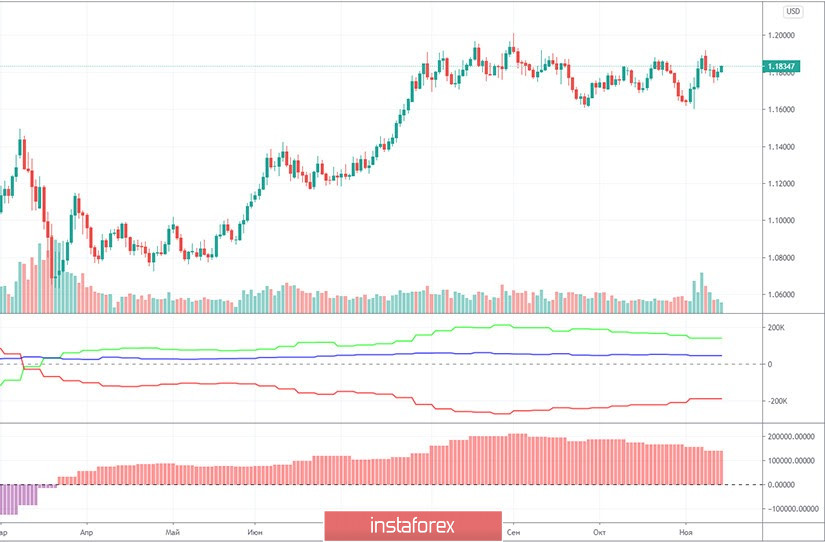
The EUR/USD pair increased by 170 points in the last reporting week (November 3-9). The US presidential elections provoked a rather strong drop in the US currency, however, it lasted no more than a few days. Nevertheless, the euro rose in price, and market participants can expect that professional traders are leaning towards being bullish. However, the latest Commitment of Traders (COT) report showed that the mood of large traders has become more bearish. The net position of the "non-commercial" group of traders decreased again, this time by 17,000 contracts, which is quite a lot. Recall that non-commercial traders have been reducing their net position for several consecutive weeks, which is eloquently signaled by the lower indicator in the chart. A decrease in the net position, in fact, means that Buy-contracts (longs) are closed and Sell-contracts (shorts) are opened. The first professional traders closed 9,200 during the reporting week, and the second - opened 7,800. However, despite the fact that the net position of non-commercial traders has been falling since the beginning of September, the downward trend has still not started for the EUR/USD pair. The green and red lines on the first indicator continue to move towards each other, which means that the trend has already begun long ago. However, there is actually no downward movement in the long term. Therefore, based on the latest COT report, we can say the following: our forecasts remain the same, since the report data allows only such conclusions to be drawn. We still believe that the upward trend has ended at around 1.2000.
There were a lot of macroeconomic statistics on Friday, November 13, but the euro/dollar pair was very sluggish for most of the day and so it ended the day with low volatility of around 40 points. Thus, in almost any case, traders ignored all of the reports. However, after analyzing it, we can still draw certain conclusions. For example, inflation in Germany remained at a negative level of -0.2% y/y. This means that the situation remains unchanged and it will be extremely difficult for the German economy to expect net growth in the near future, rather than to recover from the fall in the second quarter. Moreover, a new lockdown may lead to a new drop in GDP. The US inflation report also showed a deterioration, as it fell from 1.4% y/y to 1.2% y/y. Inflation, excluding food and energy, also declined. And so the dollar did not receive support during the day. The speeches of Jerome Powell and Christine Lagarde did not provide any new information to the markets.
No important macroeconomic reports for the European Union and the United States on Monday, November 16. Therefore, volatility could remain at a low level. The general fundamental background now also does not contribute to active trading. Traders will only have to rely on technical analysis on Monday.
We have two trading ideas for November 16:
1) Buyers kept the pair above the Senkou Span B line (1.1760), but now they need to go beyond the Kijun-sen line (1.1833) in order to expect another 70 points to rise. If the price settles above this line, then you are advised to open long positions while aiming for the resistance area of 1.1886-1.1912. Take Profit in this case will be about 40-50 points.
2) Bears started their trend, however, they stumbled upon a serious obstacle near the Senkou Span B line (1.1760). Thus, in order to be able to resume trading down while aiming for the Senkou Span B line (1.1760) and the support area of 1.1692-1.1699,it is necessary for the price to rebound from the Kijun-sen line (1.1833). Take Profit in this case can range from 50 to 110 points.
Hot forecast and trading signals for GBP/USD
Explanations for illustrations:
Support and Resistance Levels are the levels that serve as targets when buying or selling the pair. You can place Take Profit near these levels.
Kijun-sen and Senkou Span B lines are lines of the Ichimoku indicator transferred to the hourly timeframe from the 4-hour one.
Support and resistance areas are areas from which the price has repeatedly rebounded off.
Yellow lines are trend lines, trend channels and any other technical patterns.
Indicator 1 on the COT charts is the size of the net position of each category of traders.
Indicator 2 on the COT charts is the size of the net position for the "non-commercial" group.
Dzięki analizom InstaForex zawsze będziesz na bieżące z trendami rynkowymi! Zarejestruj się w InstaForex i uzyskaj dostęp do jeszcze większej liczby bezpłatnych usług dla zyskownego handlu.


