 Zostať
Podmienky obchodovania
Nástroje


The GBP/USD currency pair showed absolutely no interesting movements on Friday. The last trading day of the previous week saw the publication of UK retail sales data, which closed a package of British data. Recall that earlier in the week, important reports on inflation and unemployment were released, showing figures that made the pound want to cry. However, throughout the week, the market actively ignored the macroeconomic backdrop, so the British currency held steady and even gained about 100 pips. Recall that the week prior, the British pound collapsed by 300 pips, partly preemptively in response to the same negative inflation report, which will essentially force the Bank of England to abandon raising the key rate in June. The new week could start with a rise in the GBP/USD pair, as Donald Trump announced today an agreement on a memorandum of understanding with Iran. Thus, a new wave of optimism could sweep across the markets as early as Monday night.
In technical terms, the downward trend remains on the hourly timeframe. There is no trendline, and the trend will be recognized as complete if the pair breaks the Senkou Span B line. Geopolitics often shifts, and as a result, the direction of movements constantly changes. Even Trump's optimistic statements over the weekend may not be confirmed by real facts in the coming week. The memorandum must be signed for the market to celebrate. And the memorandum is not a deal, as the parties' approach to resolving the "nuclear issue" remains unclear.
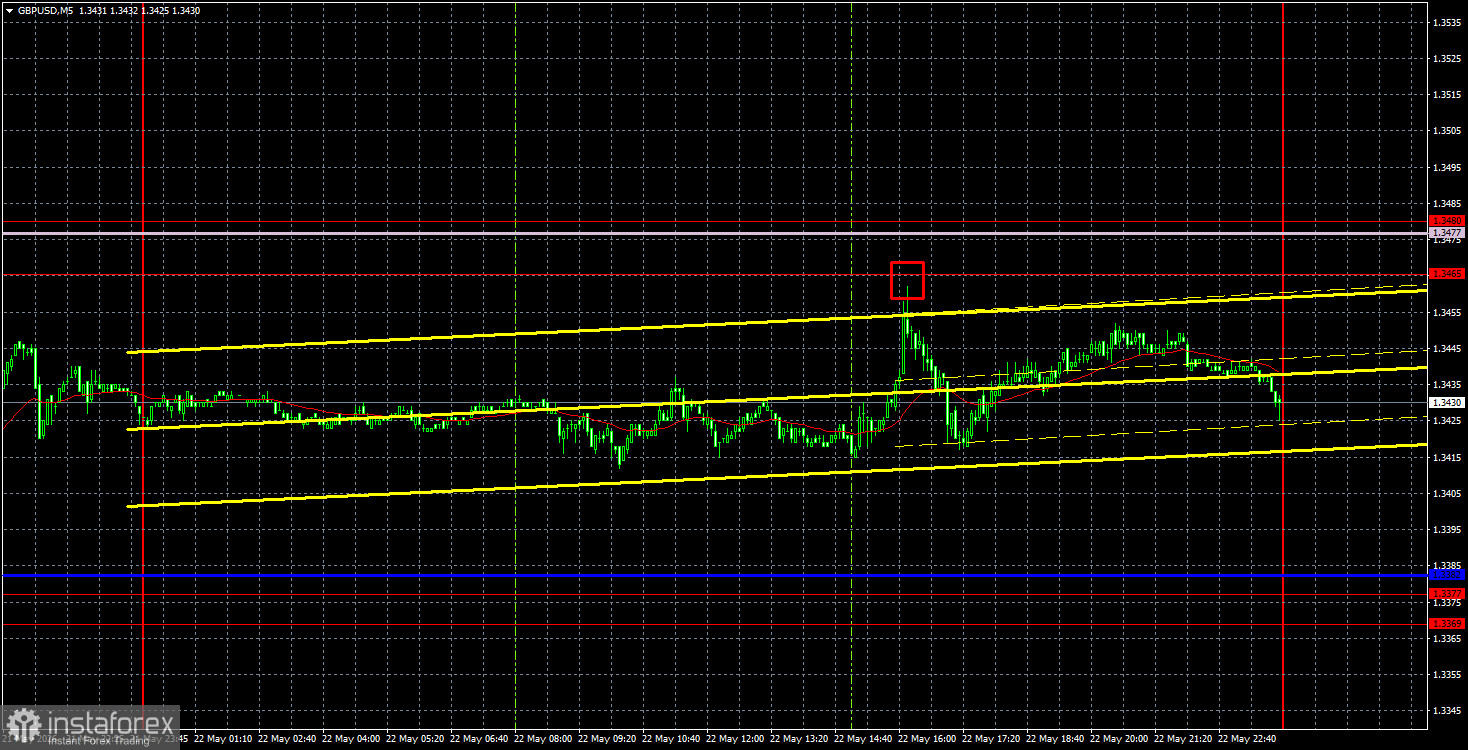
On the 5-minute timeframe on Friday, one sell signal was generated when the price bounced with minimal deviation from the 1.3465-1.3480 area. By the end of the day, the trade could have been closed, as the price did not rush downward. The profit was minimal.
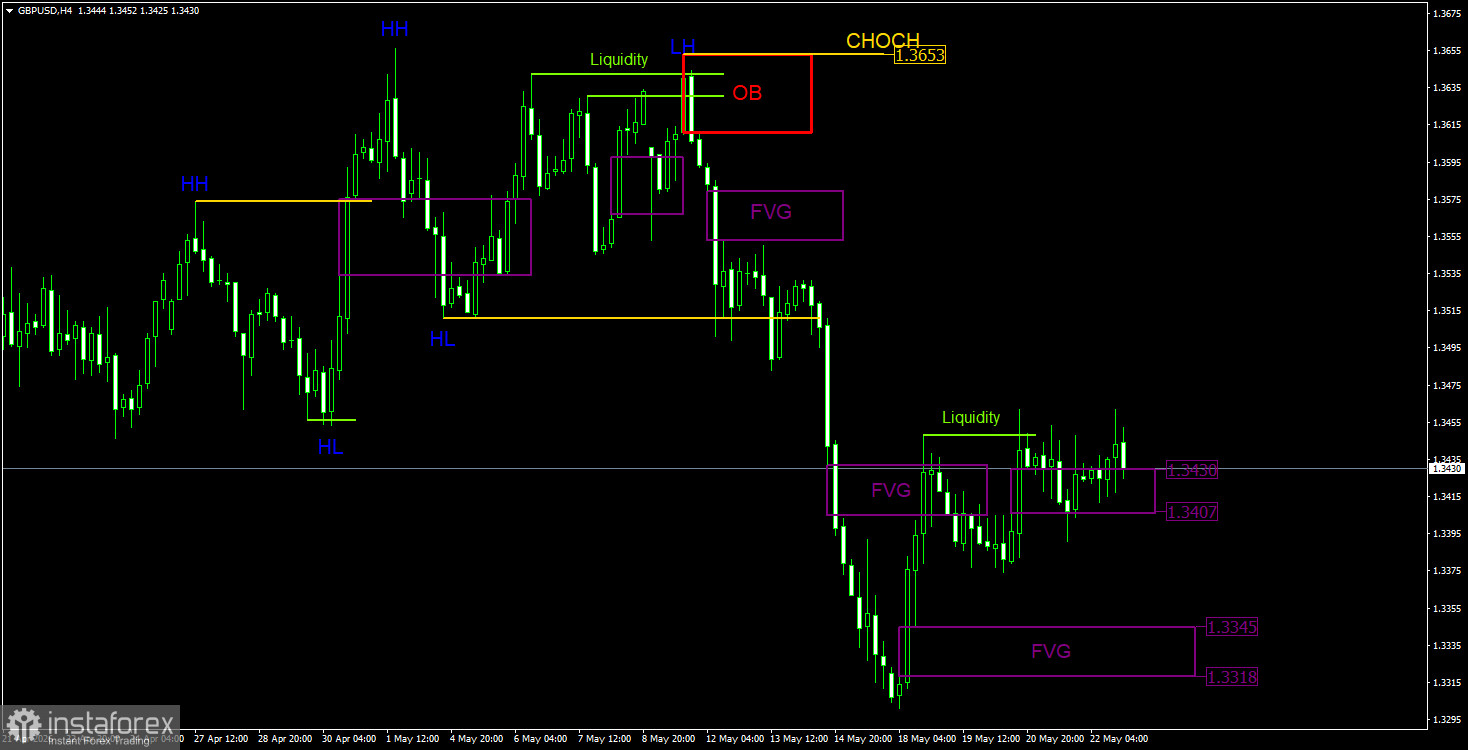
On the 4-hour timeframe, the British pound is also within a downward trend after breaking the upward structure last week. Since the price dropped 300 pips, the CHOCH line is at 1.3653 and cannot yet be moved lower. On Tuesday, the price reacted to the "bearish" FVG, but the reaction was very weak, and the decline did not last long. The "bullish" FVG in the area of 1.3318-1.3345 has not been worked through. The last one formed was a bullish pattern FVG in the area of 1.3407-1.3430, which has already reacted in price. Given the geopolitical backdrop, growth from this pattern may continue at the start of the new week.
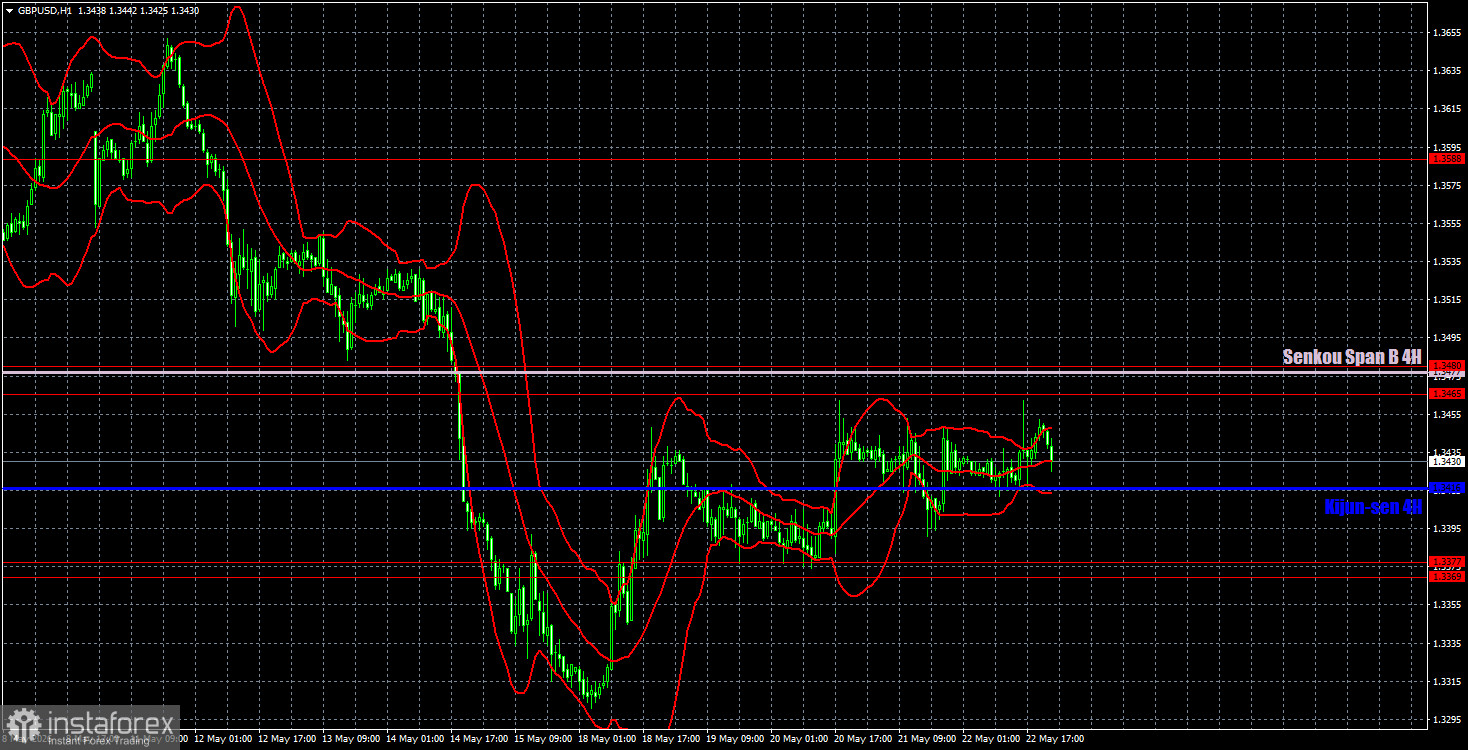
On the hourly timeframe, the GBP/USD pair is attempting to start a new upward trend, but a downward trend is preserved below the Senkou Span B line. The macroeconomic and fundamental backdrop still has little influence on the pair's movements, and geopolitics regularly provokes price fluctuations in both directions. We do not believe that without a real escalation of the conflict in the Middle East, the dollar will continue to strengthen.
For May 25, we highlight the following important levels: 1.3096-1.3115, 1.3179-1.3187, 1.3369-1.3377, 1.3465-1.3480, 1.3588, 1.3671-1.3681, 1.3751-1.3763. The Senkou Span B (1.3477) and Kijun-sen (1.3416) lines may also be sources of signals. It is recommended to set the Stop Loss at breakeven when the price moves in the correct direction by 20 pips. The Ichimoku indicator's lines may move throughout the day, which should be taken into account when determining trading signals.
On Monday, there are no interesting events planned in the UK or the U.S., so all attention is on geopolitics. Trump's statements about coordinating a memorandum with Iran must be confirmed in Tehran, and then the document must be signed. In this case, the American currency will begin/continue to fall, while the EUR/USD and GBP/USD pairs will begin/continue to rise.
Today, traders can open short positions targeting 1.3416 and 1.3369-1.3377 when the price bounces from the 1.3465-1.3480 area. Long positions can be opened if the price consolidates above the 1.3465-1.3480 area, with a target of 1.3588. On the 4-hour timeframe, long positions are relevant after a buy signal is formed in the area of 1.3407-1.3430 on Friday.
Price support and resistance levels – thick red lines, around which movement may conclude. They are not sources of trading signals.
Kijun-sen and Senkou Span B lines – lines of the Ichimoku indicator moved to the hourly timeframe from the 4-hour one. They are strong lines.
Extreme levels – thin red lines from which the price previously bounced. They are sources of trading signals.
Yellow lines – trend lines, trend channels, and any other technical patterns.
CHOCH – break in the trend structure.
Liquidity – liquidity, stop loss, and pending orders that market makers use to establish their positions.
FVG – price inefficiency area. Prices pass through such areas very quickly, indicating a complete absence of one side in the market. Subsequently, the price tends to return and react from these areas, continuing the main trend.
IFVG – inverted price inefficiency area. After returning to such an area, the price does not react to it; instead, it impulsively breaks through and then tests from the other side.
OB – order block. A candle in which the market maker opened a position to take liquidity and establish its own position in the opposite direction.
InstaForex analytical reviews will make you fully aware of market trends! Being an InstaForex client, you are provided with a large number of free services for efficient trading.


