 Maradok
Kereskedési feltételek
Products
Eszkozok


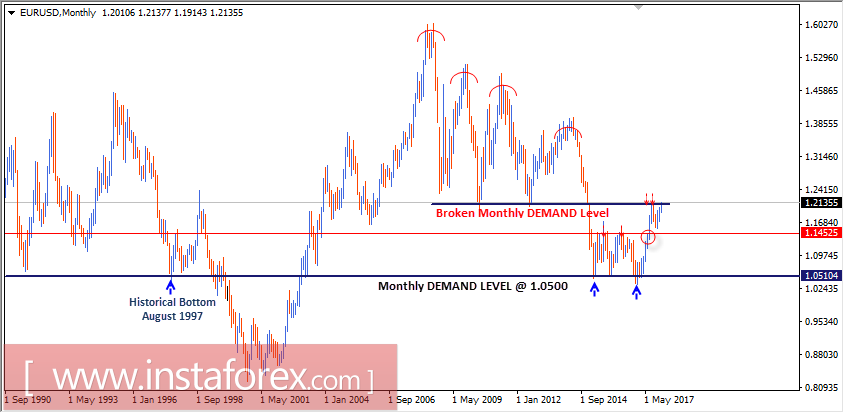
Monthly Outlook
In January 2015, the EUR/USD pair moved below the major demand levels near 1.2050-1.2100 (multiple previous bottoms set in July 2012 and June 2010). Hence, a long-term bearish target was projected toward 0.9450.
In March 2015, EUR/USD bears challenged the monthly demand level around 1.0500, which had been previously reached in August 1997.
In the longer term, the level of 0.9450 remains a projected target if any monthly candlestick achieves bearish closure below the depicted monthly demand level of 1.0500.
However, the EUR/USD pair has been trapped within the depicted consolidation range (1.0500-1.1450) until the current bullish breakout was executed above 1.1450.
The current bullish breakout above 1.1450 allowed a quick bullish advance towards 1.2100 where recent evidence of bearish rejection was expressed (Note the Monthly candlestick of September).
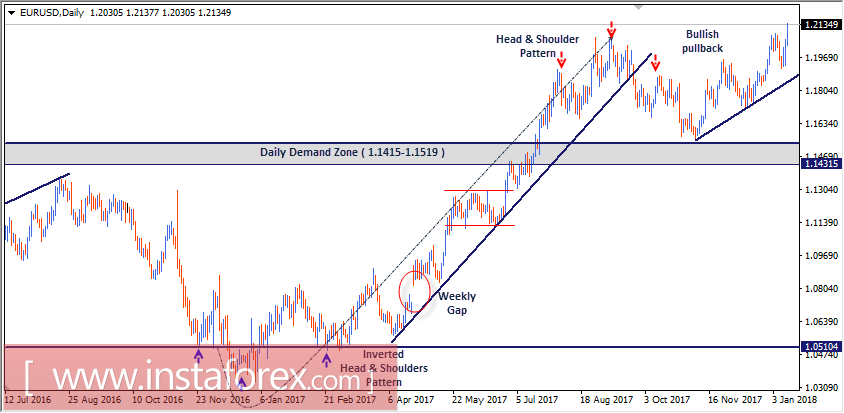
Daily Outlook
As anticipated, the ongoing bullish momentum allowed the EUR/USD pair to pursue further bullish advance towards 1.1415-1.1520 (Previous Daily Supply-Zone).
The daily supply zone failed to pause the ongoing bullish momentum. Instead, evident bullish breakout was expressed towards the price level of 1.2100 where the depicted Head and Shoulders reversal pattern was expressed.
If the recent bearish breakout persists below 1.1700 (Neckline of the reversal pattern), a quick bearish decline should be expected towards the price zone of 1.1415-1.1520 (Initial targets for the depicted H&S pattern).
Bearish target for the depicted Head and Shoulders pattern extends towards 1.1350. However, to pursue towards the mentioned target level, significant bearish pressure is needed to be applied against the mentioned zone (1.1415-1.1520).
However, In November, recent price action around the price zone of 1.1520-1.1415 indicated evident bullish recovery.
This hindered further bearish decline which allowed the current bullish pullback to occur towards the price level of 1.2100 where price action should be watched for a valid SELL entry.
On the other hand, daily persistence above 1.2100 confirms the depicted bullish continuation pattern with projected targets towards 1.2500.
InstaForex analytical reviews will make you fully aware of market trends! Being an InstaForex client, you are provided with a large number of free services for efficient trading.

