 Maradok
Kereskedési feltételek
Products
Eszkozok


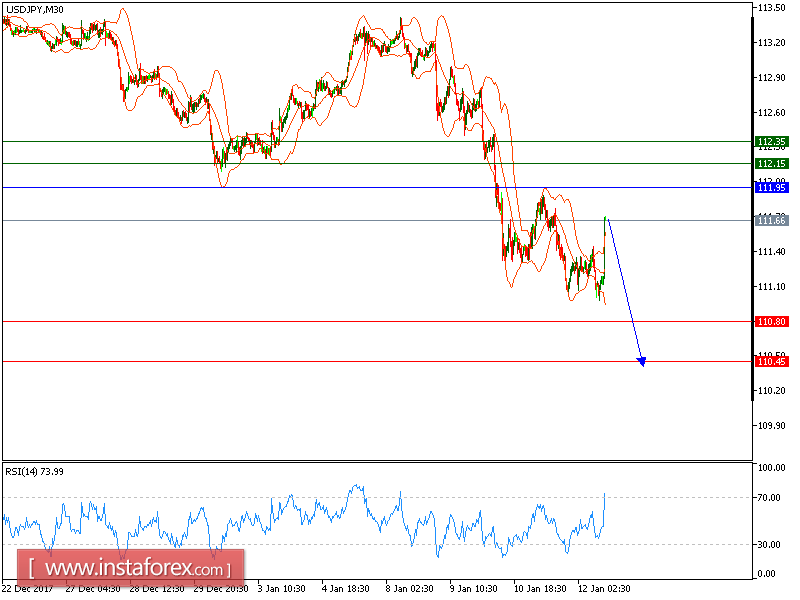
USD/JPY is under pressure. The pair tested the support at the key level of 111.00 overnight (January 11). Currently, the pair is off that low but remains capped by the descending 20-period moving average, which stands below the 50-period one. And the relative strength index is yet to recover the neutrality level of 50, showing a lack of upward momentum for the pair.
The U.S. dollar remained on the defensive as the euro jumped 0.7% to US$1.2031 (day-high at US$1.2059) as the European Central Bank's December meeting minutes helped to boost investors' expectations that the central bank is preparing to reduce its monetary stimulus program.
Therefore, intraday bearishness persists, and the pair should sink toward 110.45 once crossing below 110.80.
Alternatively, if the price moves in the opposite direction, a short position is recommended below 111.95 with a target of 110.80.
Chart Explanation: The black line shows the pivot point. The current price above the pivot point indicates a bullish position, while the price below the pivot point is a signal for a short position. The red lines show the support levels and the green line indicates the resistance level. These levels can be used to enter and exit trades.
Strategy: SELL, stop loss at 111.95, take profit at 110.80.
Resistance levels: 112.15, 112.35, and 112.55
Support levels: 110.80, 110.45, and 110.00.
InstaForex analytical reviews will make you fully aware of market trends! Being an InstaForex client, you are provided with a large number of free services for efficient trading.


