 Maradok
Kereskedési feltételek
Products
Eszkozok


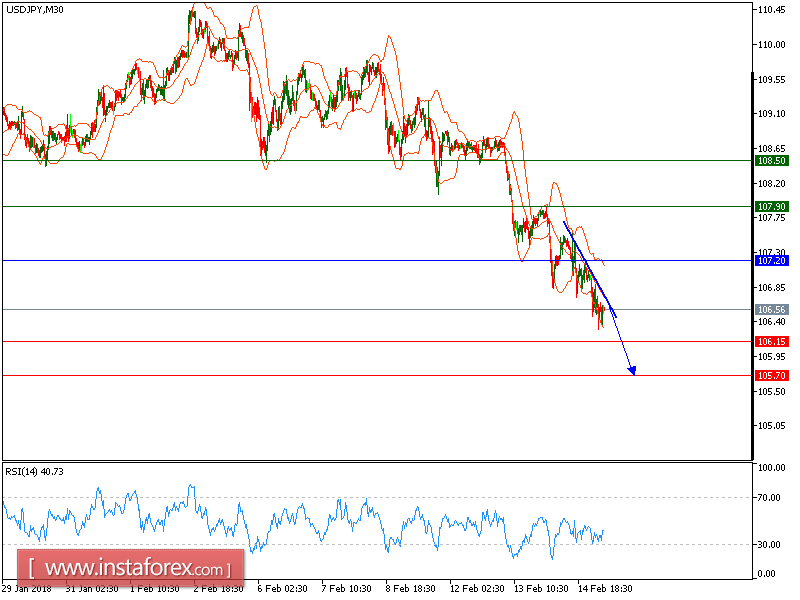
Our first downside target which we predicted in the yesterday's analysis has been hit, and the price is moving towards the second target which we highlighted yesterday. The pair keeps breaching the lower Bollinger band while being capped by a declining trend line drawn from 107.90 (the high of yesterday, February 14). Extra resistance is exerted by the descending 20-period moving average, which stays below the 50-period one. Downward momentum is also evidenced by the badly-directed relative strength index, which has fallen into the 30s while capped by a declining trend line. Strong intraday bearishness persists, and the pair should proceed toward the first downside target at 106.15 before sinking further to 105.70. Key resistance is located at 107.20.
Alternatively, if the price moves in the opposite direction, a long position is recommended to be above 107.85 with a target of 108.20.
Chart Explanation: The black line shows the pivot point. The current price above the pivot point indicates a bullish position, while the price below the pivot point is a signal for a short position. The red lines show the support levels, and the green line indicates the resistance level. These levels can be used to enter and exit trades.
Strategy: SELL, stop loss at 107.20, take profit at 106.15.
Resistance levels: 107.90, 108.50, and 108.85
Support levels: 106.15, 105.70, and 105.20.
InstaForex analytical reviews will make you fully aware of market trends! Being an InstaForex client, you are provided with a large number of free services for efficient trading.

