 Maradok
Kereskedési feltételek
Products
Eszkozok


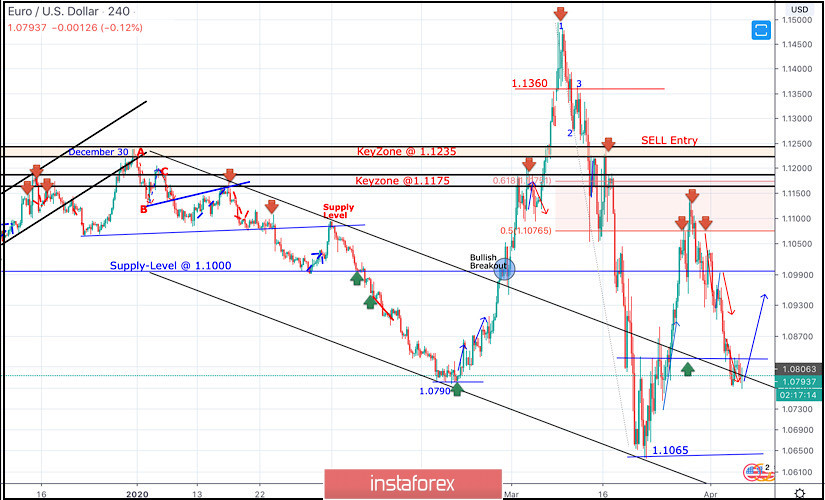
Since December 30, the EURUSD pair has trended-down within the depicted bearish channel until few weeks ago, when a new low around 1.0790 was recently established where the EUR/USD pair looked OVERSOLD after such extensive bearish decline.
On February 20, recent signs of bullish recovery were demonstrated around 1.0790 leading to the recent steep bullish movement towards 1.1000, 1.1175, 1.1360 and finally 1.1480 where a (123) bearish reversal pattern was initiated around.
This turned the short-term technical outlook for the EURUSD pair into bearish when bearish persistence below the Key Zones of 1.1235 and 1.1175 was maintained on a daily basis.
Few weeks ago, the EURUSD pair has expressed significant bullish recovery around the newly-established bottom around 1.1065.
The recent bullish engulfing H4 candlesticks as well as the recently-demonstrated ascending bottoms indicated a high probability bullish pullback at least towards 1.0980 and 1.1075 (Fibonacci Level 50%).
Key Supply-Levels in confluence with significant Fibonacci levels are located around 1.1075 (50% Fibonacci) and 1.1175 (61.8% Fibonacci) where bearish rejection was highly-expected.
Moreover, a Head & Shoulders reversal pattern was being demonstrated around the price levels of (1.1000 - 1.1075).
The reversal pattern neckline existing near the key-level around 1.1000 was recently breached to the downside confirming the reversal.
Shortly after, further bearish decline was being demonstrated towards 1.0800 where the nearest demand level to be considered is located near the backside of the broken channel around 1.0800-1.0750 where bullish rejection may exist soon.
Trade recommendations :
Intraday traders can wait for more bearish pullback towards the mentioned demand-zone around 1.0800-1.0750 and look for any bullish rejection signs as a valid BUY signal for a short-term trade.
S/L to be placed below 1.0700 while Initial T/P level to be located around 1.0870, 1.0920 and 1.1000.
InstaForex analytical reviews will make you fully aware of market trends! Being an InstaForex client, you are provided with a large number of free services for efficient trading.

