 Maradok
Kereskedési feltételek
Products
Eszkozok


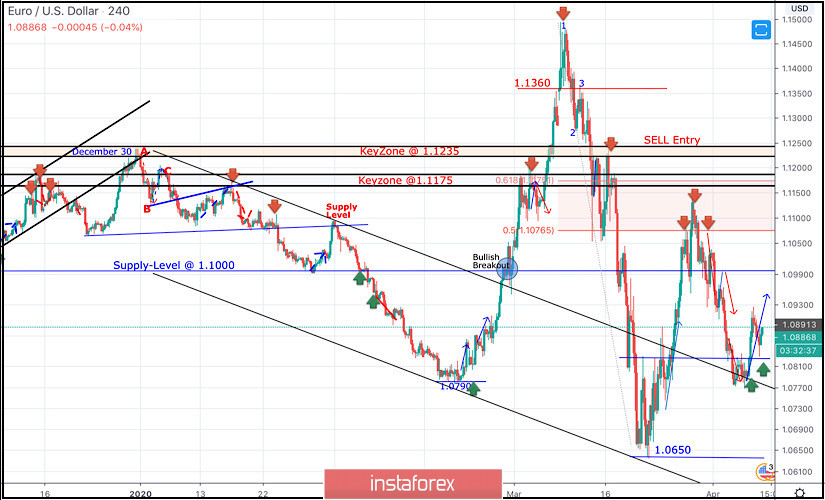
Since December 30, the EURUSD pair has trended-down within the depicted bearish channel until the depicted two successive Bottoms were established around 1.0790 then 1.0650 where the EUR/USD pair looked OVERSOLD after such extensive bearish decline.
Few weeks ago, the EURUSD pair has expressed significant bullish recovery around the newly-established bottom around 1.0650.
The following bullish engulfing H4 candlesticks as well as the recently-demonstrated ascending bottoms indicated a high probability bullish pullback at least towards 1.0980 and 1.1075 (Fibonacci Level 50%).
Key Supply-Levels in confluence with significant Fibonacci levels are located around 1.1075 (50% Fibonacci) and 1.1175 (61.8% Fibonacci) where bearish rejection was highly-expected.
Moreover, a Head & Shoulders continuation pattern was demonstrated around the price levels of (1.1000 - 1.1075).
Shortly after, further bearish decline was demonstrated towards 1.0800 where the nearest demand level to be considered was located near the backside of the broken channel (1.0800-1.0750).
Early signs of Bullish rejection have been manifested around the price zone of (1.0800-1.0750) leading to the current bullish spike up to 1.0920.
This supports the bullish side of the market as long as bullish persistence is maintained above the recently-established ascending Bottom around 1.0770.
On the other hand, any bearish breakout below 1.0770 invalidates the previously-mentioned outlook
Trade recommendations :
Intraday traders can wait for another bearish pullback towards the mentioned demand-zone around 1.0800-1.0750 for a valid short-term BUY signal.
S/L to be placed below 1.0740 while Initial T/P level to be located around 1.0870, 1.0920 and 1.1000.
InstaForex analytical reviews will make you fully aware of market trends! Being an InstaForex client, you are provided with a large number of free services for efficient trading.


