 Maradok
Kereskedési feltételek
Products
Eszkozok


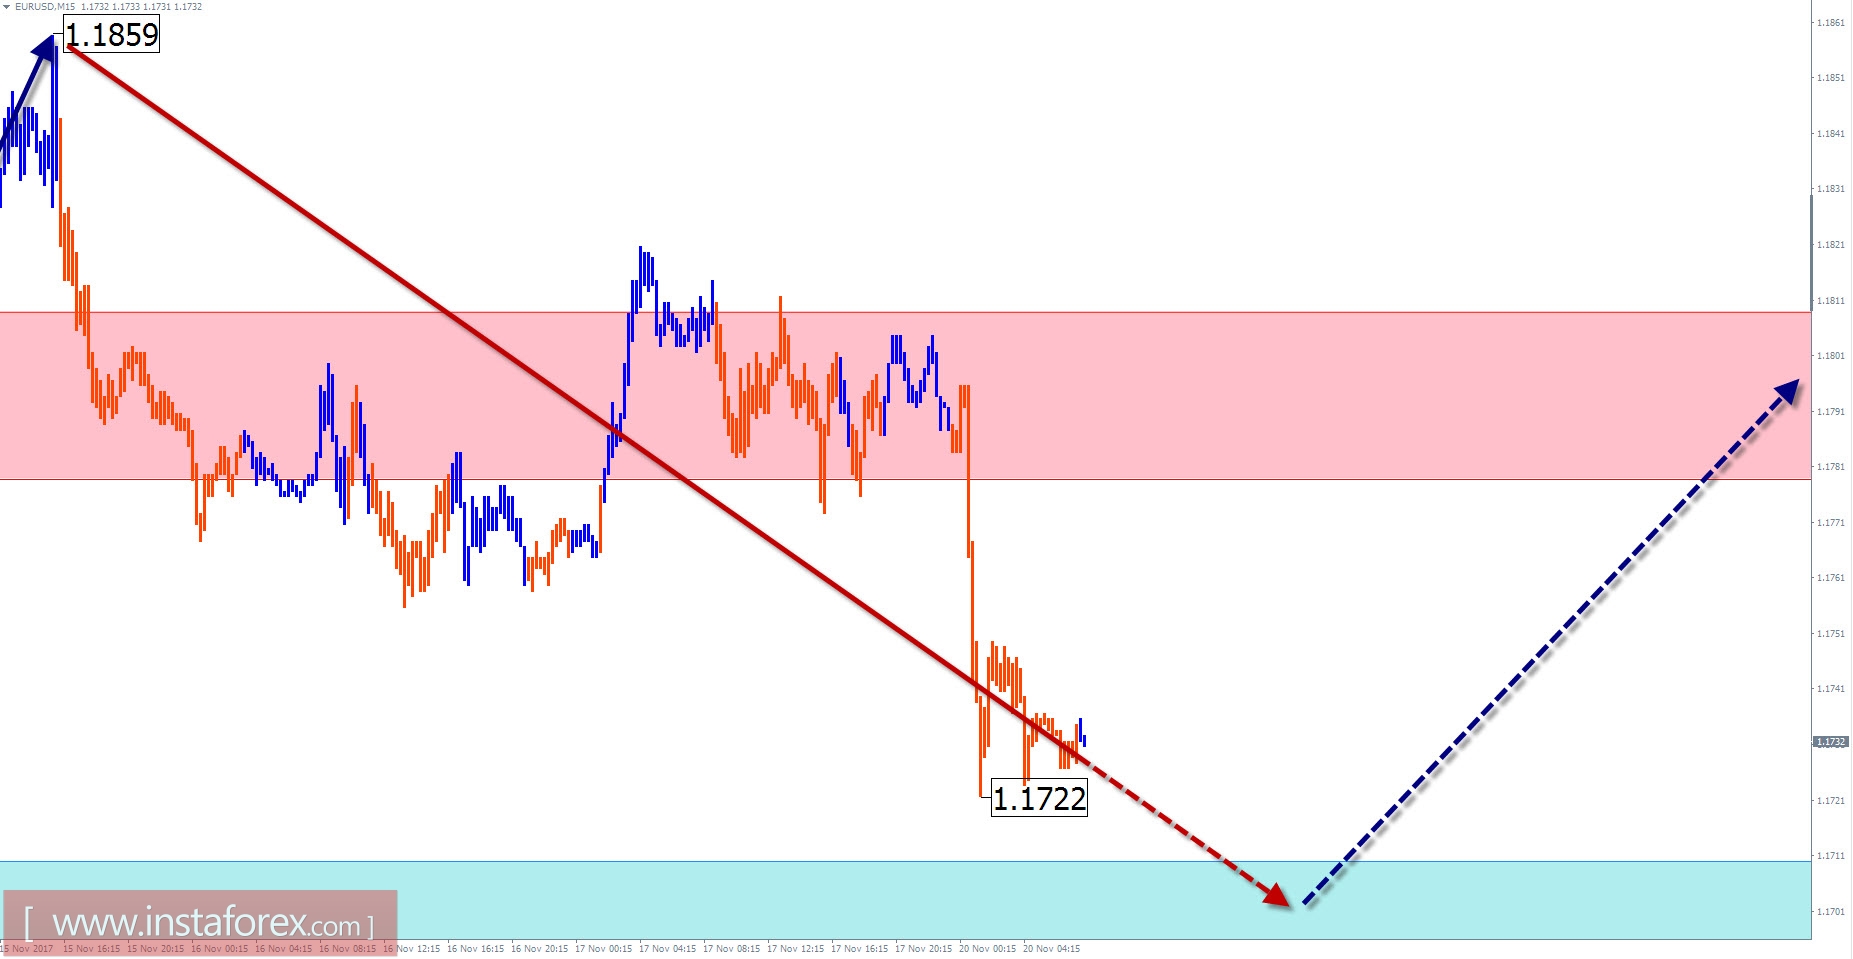
EUR / USD outlook for the current day
Higher prices of the euro currency pair formed the figure "rising ascending plane" on the daily scale of the chart. The wave structure is formed by the standard elongation level. At the same time, there are no signals of an early trend reversal on the chart. There is a high probability of the current wave.
Starting in September, the bearish wave enters the final phase. The rise of the quotation for a first ten days of November completed the correction part of the wave. Beginning on November 15, the decline was enough to turn the wave level.
In the morning for today, the price is expected to move downwards. A further change in the exchange rate is the expected rate.
Boundaries of resistance zones:
- 1.1780 / 1.1810
Boundaries of support zones:
- 1.1710 / 1.1680
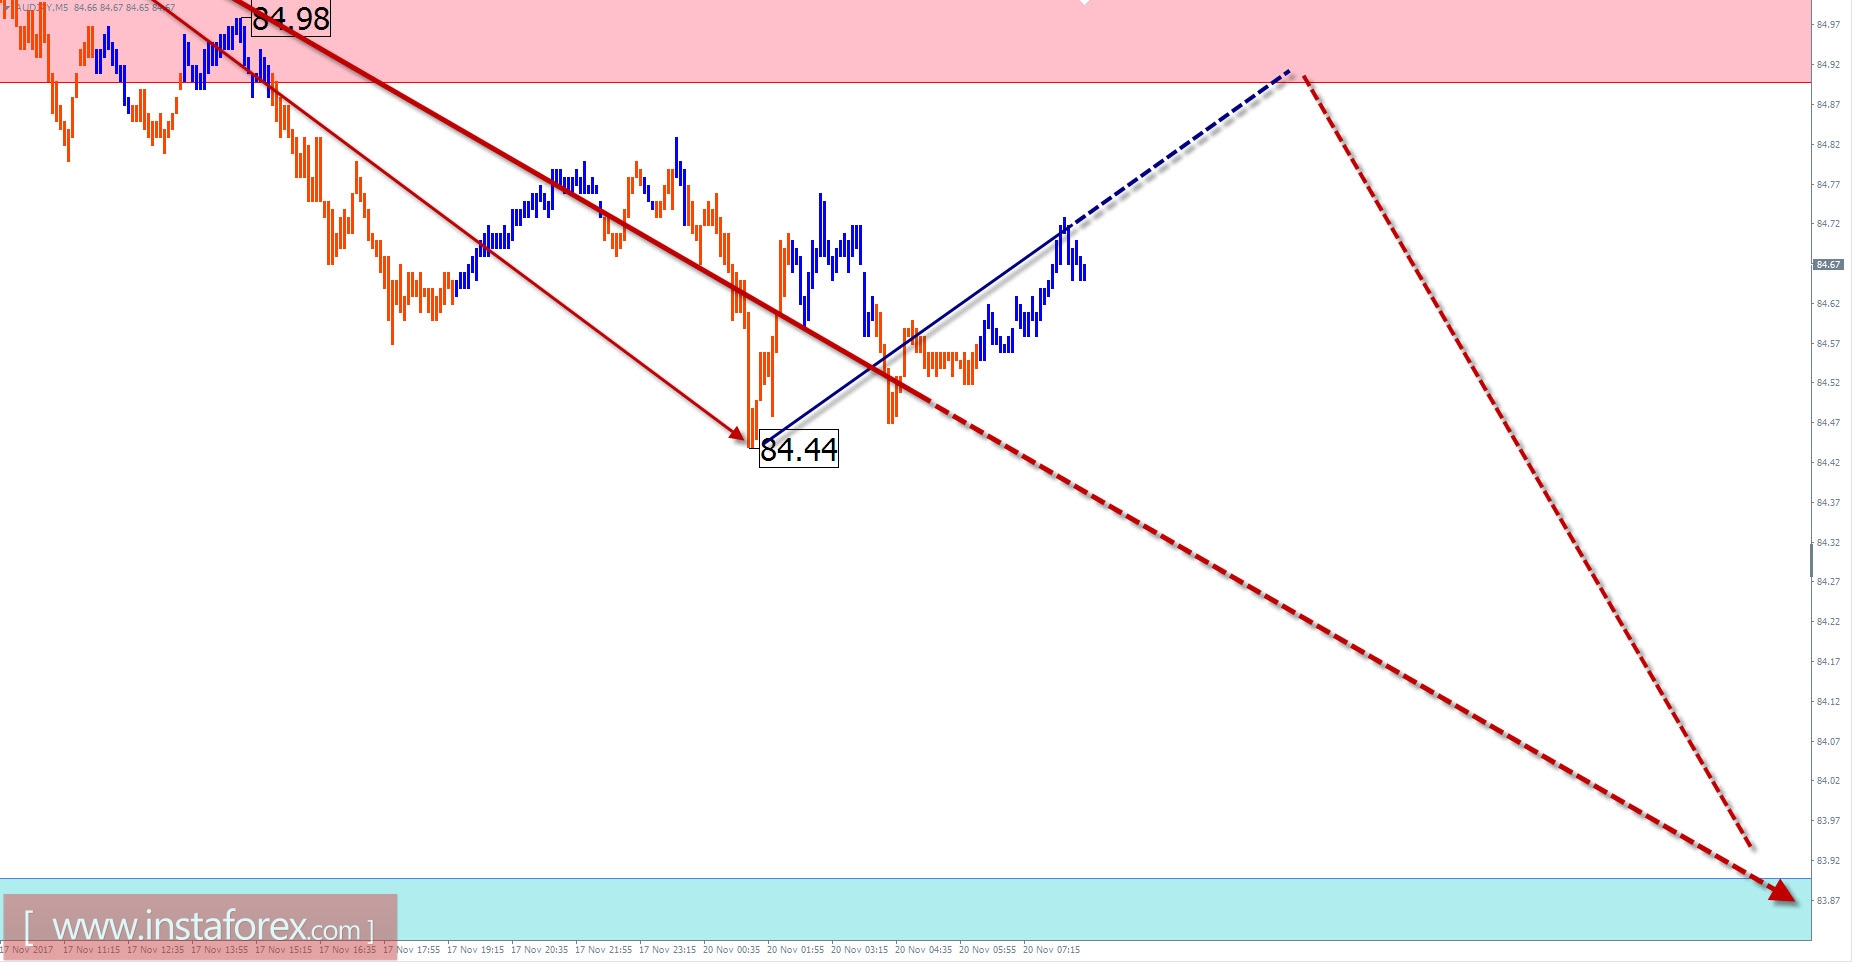
Overview of AUD / JPY with the forecast for the current day
The direction of the AUD / JPY cross currency pair in the short-term trading is set to have a downward wave. The upper limit of the next potential completion period is the price level.
In the next session, there will most likely be a flat movement with an ascending vector. The bullish plot is necessary to complete. There is a chance to return to the ascending price. On the other hand, the volatility of the instrument can dramatically increase.
Boundaries of resistance zones:
- 84.90 / 85.20
Boundaries of support zones:
- 83.90 / 60
For simplified wave analysis, a simple waveform is used that combines 3 parts namely A, B, and C. All types of correction are created and most of the impulses can be found in these waves. Every time frame is considered and the last incomplete wave is analyzed.
The areas marked on the graphs indicate the probability of a change in the direction of the movement. Arrows indicate the wave counting. A solid background of the arrows.
Attention: The wave algorithm does not take into account the duration of the movement of tools in time. The forecast is not a trading signal! To conduct a bargain, you need to confirm the signals used by your trading systems.
InstaForex analytical reviews will make you fully aware of market trends! Being an InstaForex client, you are provided with a large number of free services for efficient trading.


