 Maradok
Kereskedési feltételek
Products
Eszkozok


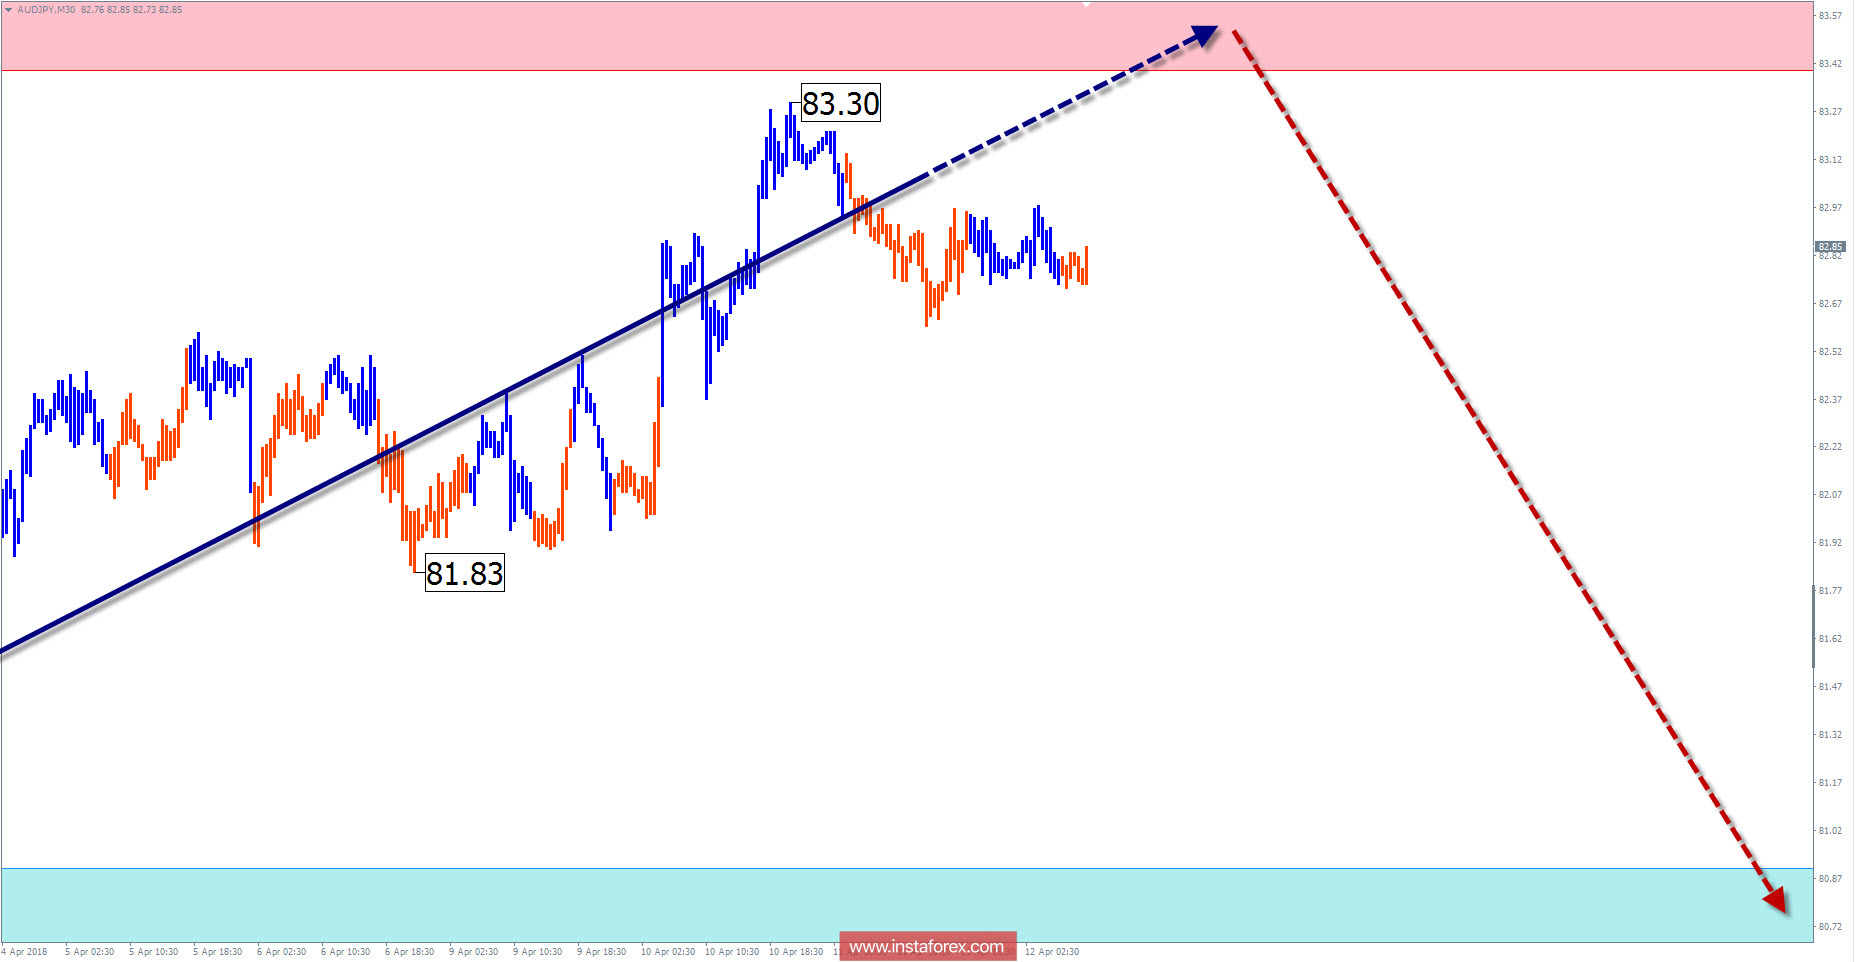
Analyzing the daily scale of the graph, the last unfinished wave has not yet been completed. This is a bullish wave zigzag on June 28, 2016, in which the middle part (B) has formed in recent months. Since January 5 of this year, price reduction has entered the final phase and is still unfinished until now. Within its framework, a pullback is formed from the intermediate support zone since March. The lower support boundary can be broken down already in the current month.
In the coming days, the price of the cross. The most likely area of the turn is the resistance zone. Then you can count on a new bear market. In the case of breaking the lower boundary of the nearest support, the downward wave will receive an additional impulse to decrease.
Boundaries of resistance zones:
- 83.40 / 83.90
Boundaries of support zones:
- 80.90 / 80.40
Explanations of the figures:
For simplified wave analysis, a simple waveform is used that combines 3 parts namely A, B, and C. All types of correction are created and most of the impulses can be found in these waves. Every time frame is considered and the last incomplete wave is analyzed.
The areas marked on the graphs indicate the probability of a change in the direction of motion has significantly increased as calculated in the areas. Arrows indicate the wave counting following the technique used by the author. A solid background of the arrows signifying the structure has been formed while the dotted one means the expected wave motion.
Attention: The wave algorithm does not take into account the duration of the movement of tools in time. The forecast is not a trading signal! To conduct a bargain, you need to confirm the signals used by your trading systems.
InstaForex analytical reviews will make you fully aware of market trends! Being an InstaForex client, you are provided with a large number of free services for efficient trading.

